

Portfolio
Akhila Gadamsetty

Projects

Design, research, and everything in between.

Resume

UX Researcher & Designer · MS HCI at Georgia Tech

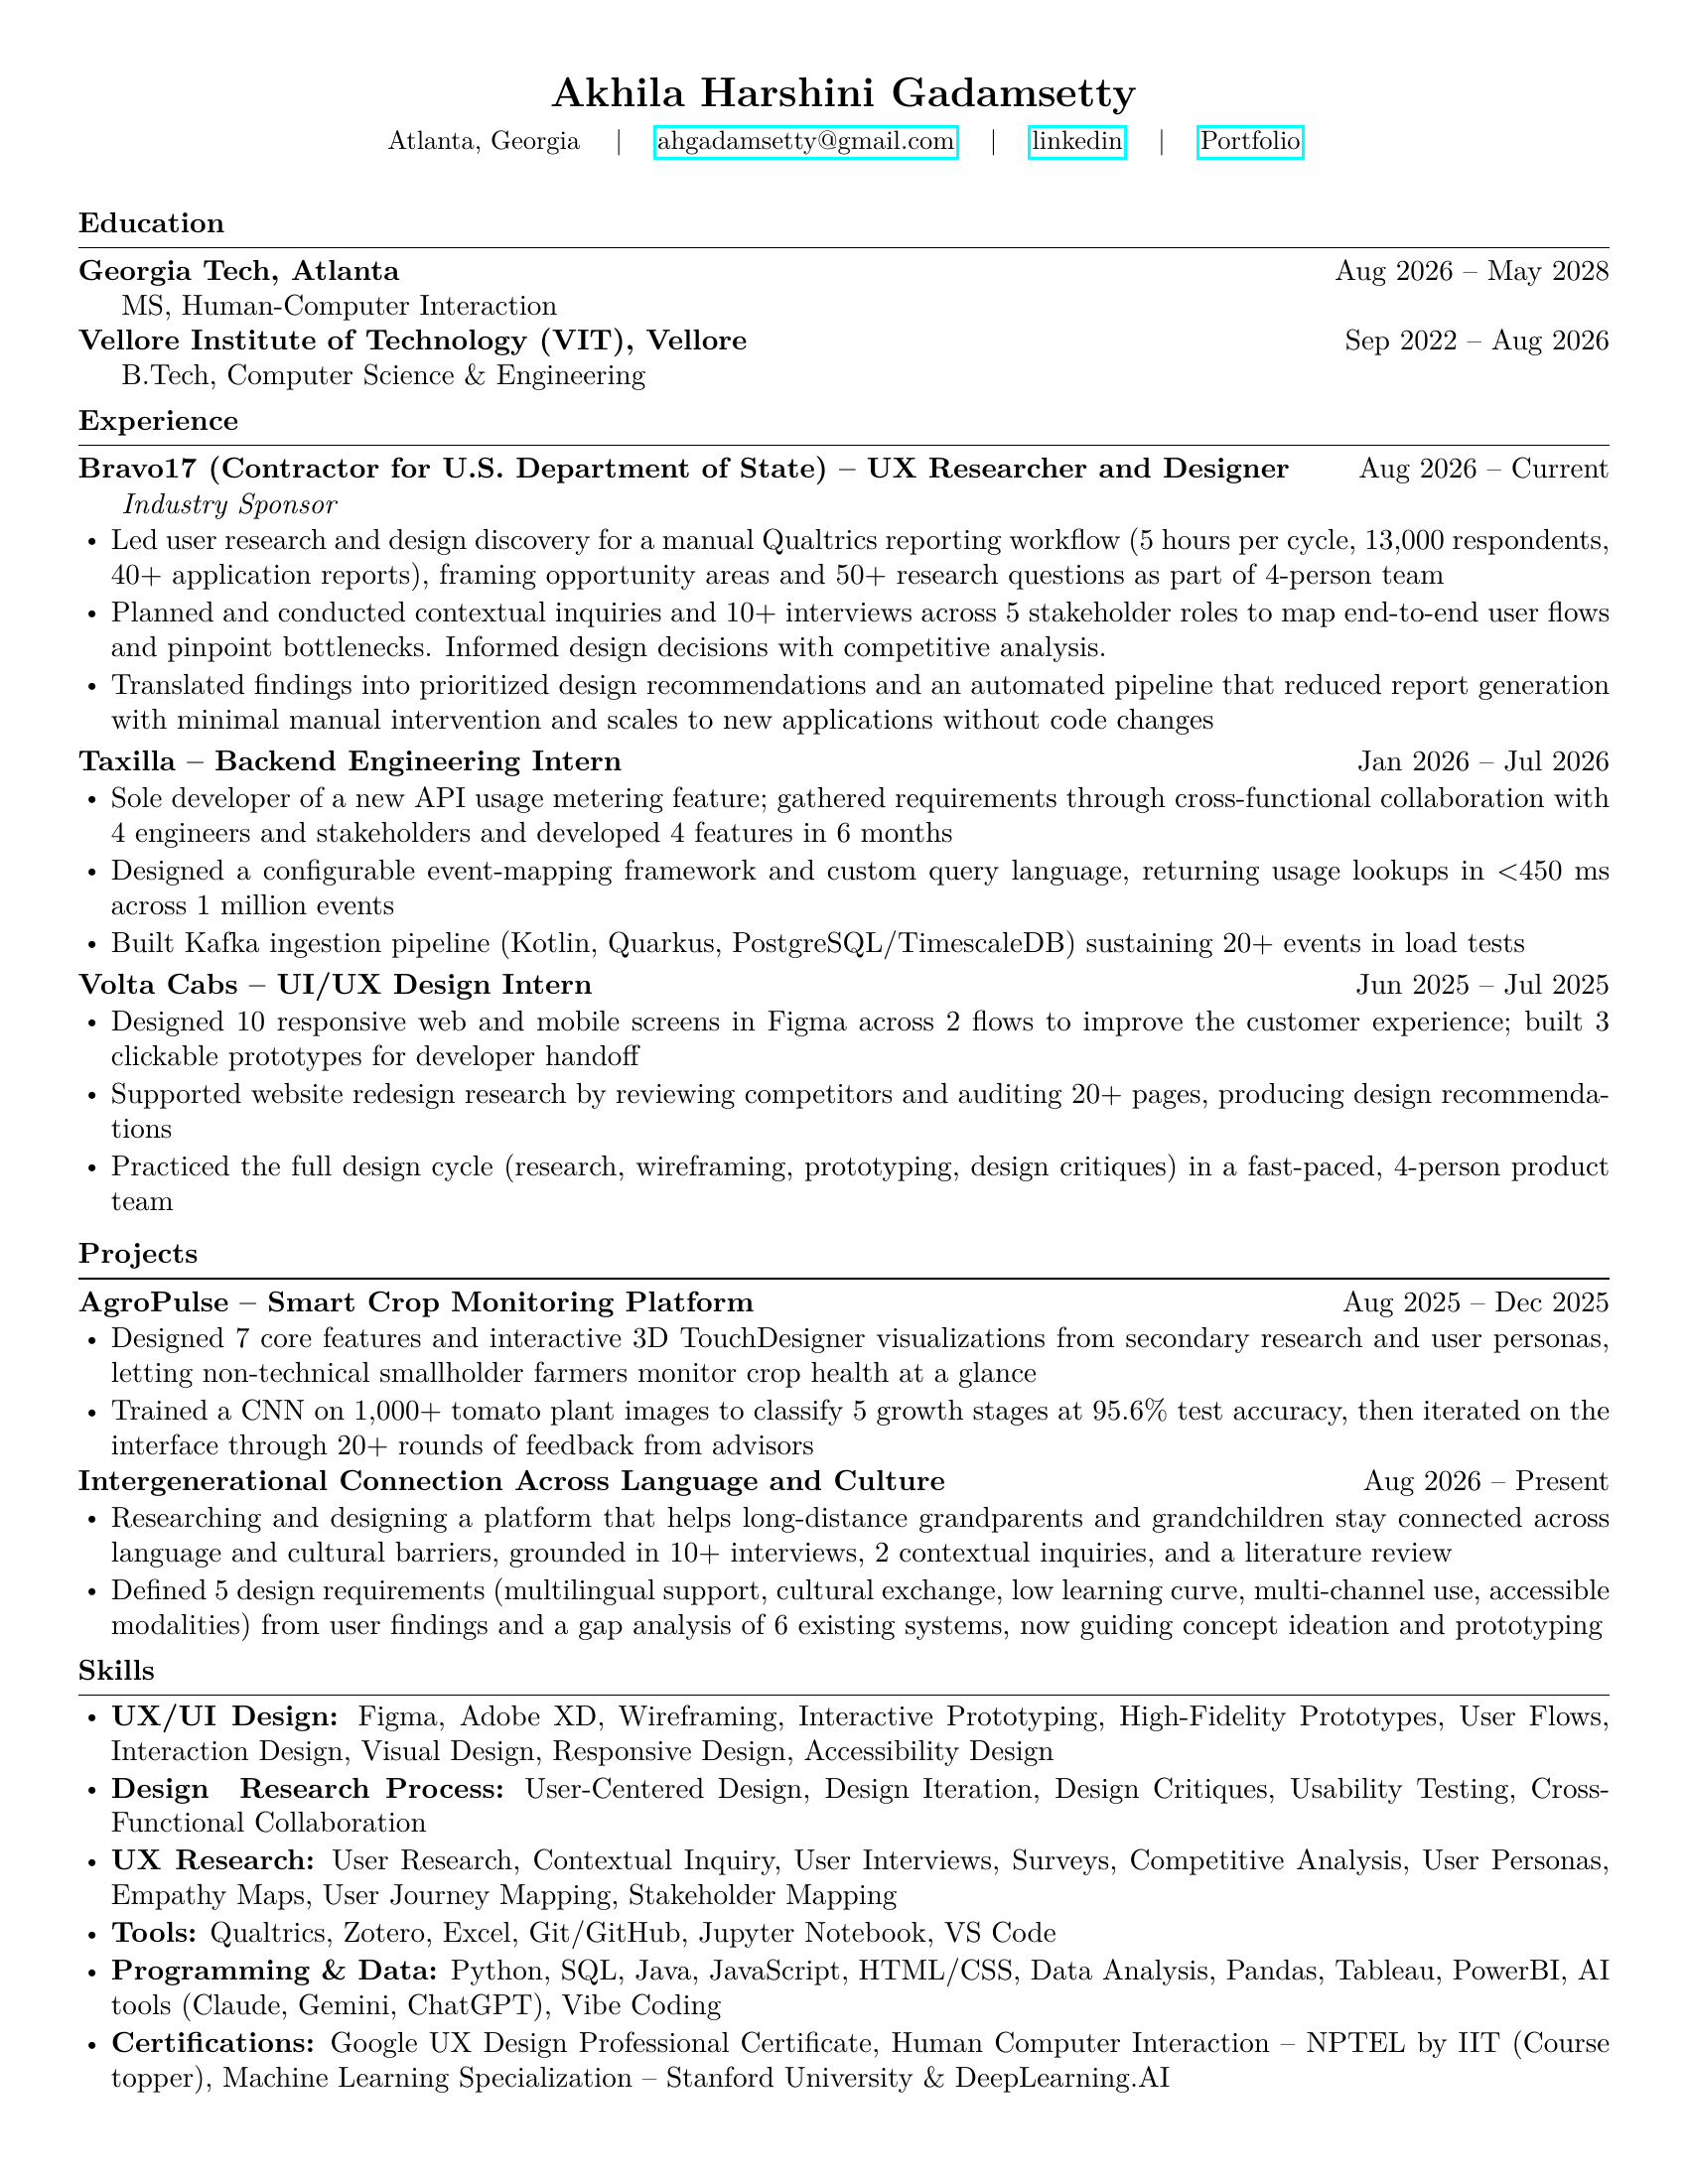
Resume of Akhila Harshini Gadamsetty. Education: MS Human-Computer Interaction, Georgia Tech, 2026 to 2028; B.Tech Computer Science and Engineering, VIT Vellore, 2022 to 2026. Experience: Bravo17, UX Researcher and Designer, Aug 2026 to current; Taxilla, Backend Engineering Intern; Volta Cabs, UI/UX Design Intern. Projects: AgroPulse smart crop monitoring platform; Intergenerational Connection Across Language and Culture. Skills in UX/UI design, UX research, programming and data.

Hi there!

I’m a Designer and Developer who loves turning messy problems into products that make sense. I’m also an Artist and a Professional Indian classical dancer, which keeps my creative muscles warm. Switching between logic and expression is how I come up with solutions that are both creative and practical.

I’m a MSHCI student @ Georgia Tech with an undergrad in Computer Science and Engineering. My work focuses on intelligent systems that people can understand, trust, and use. I love bringing my two worlds together to build things that work and feel good.

AI crop monitoring that farmers can see, trust and control
AgricultureIoT + AIMobile app

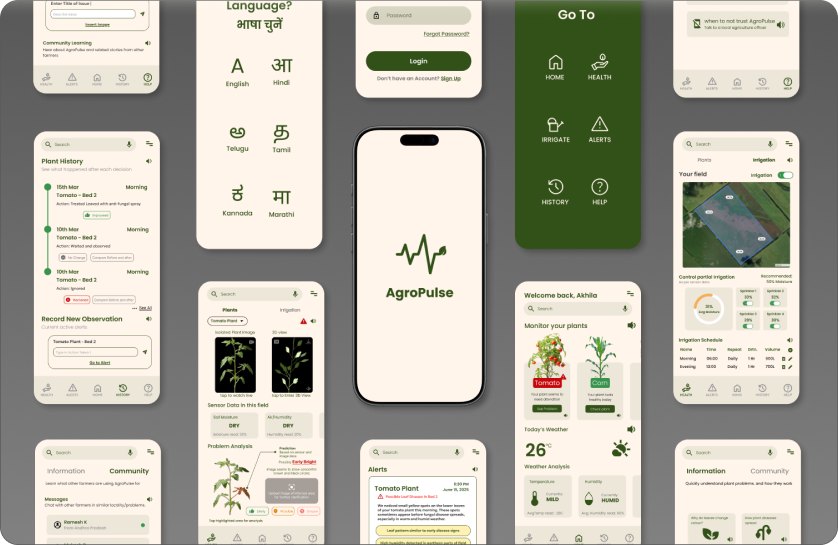
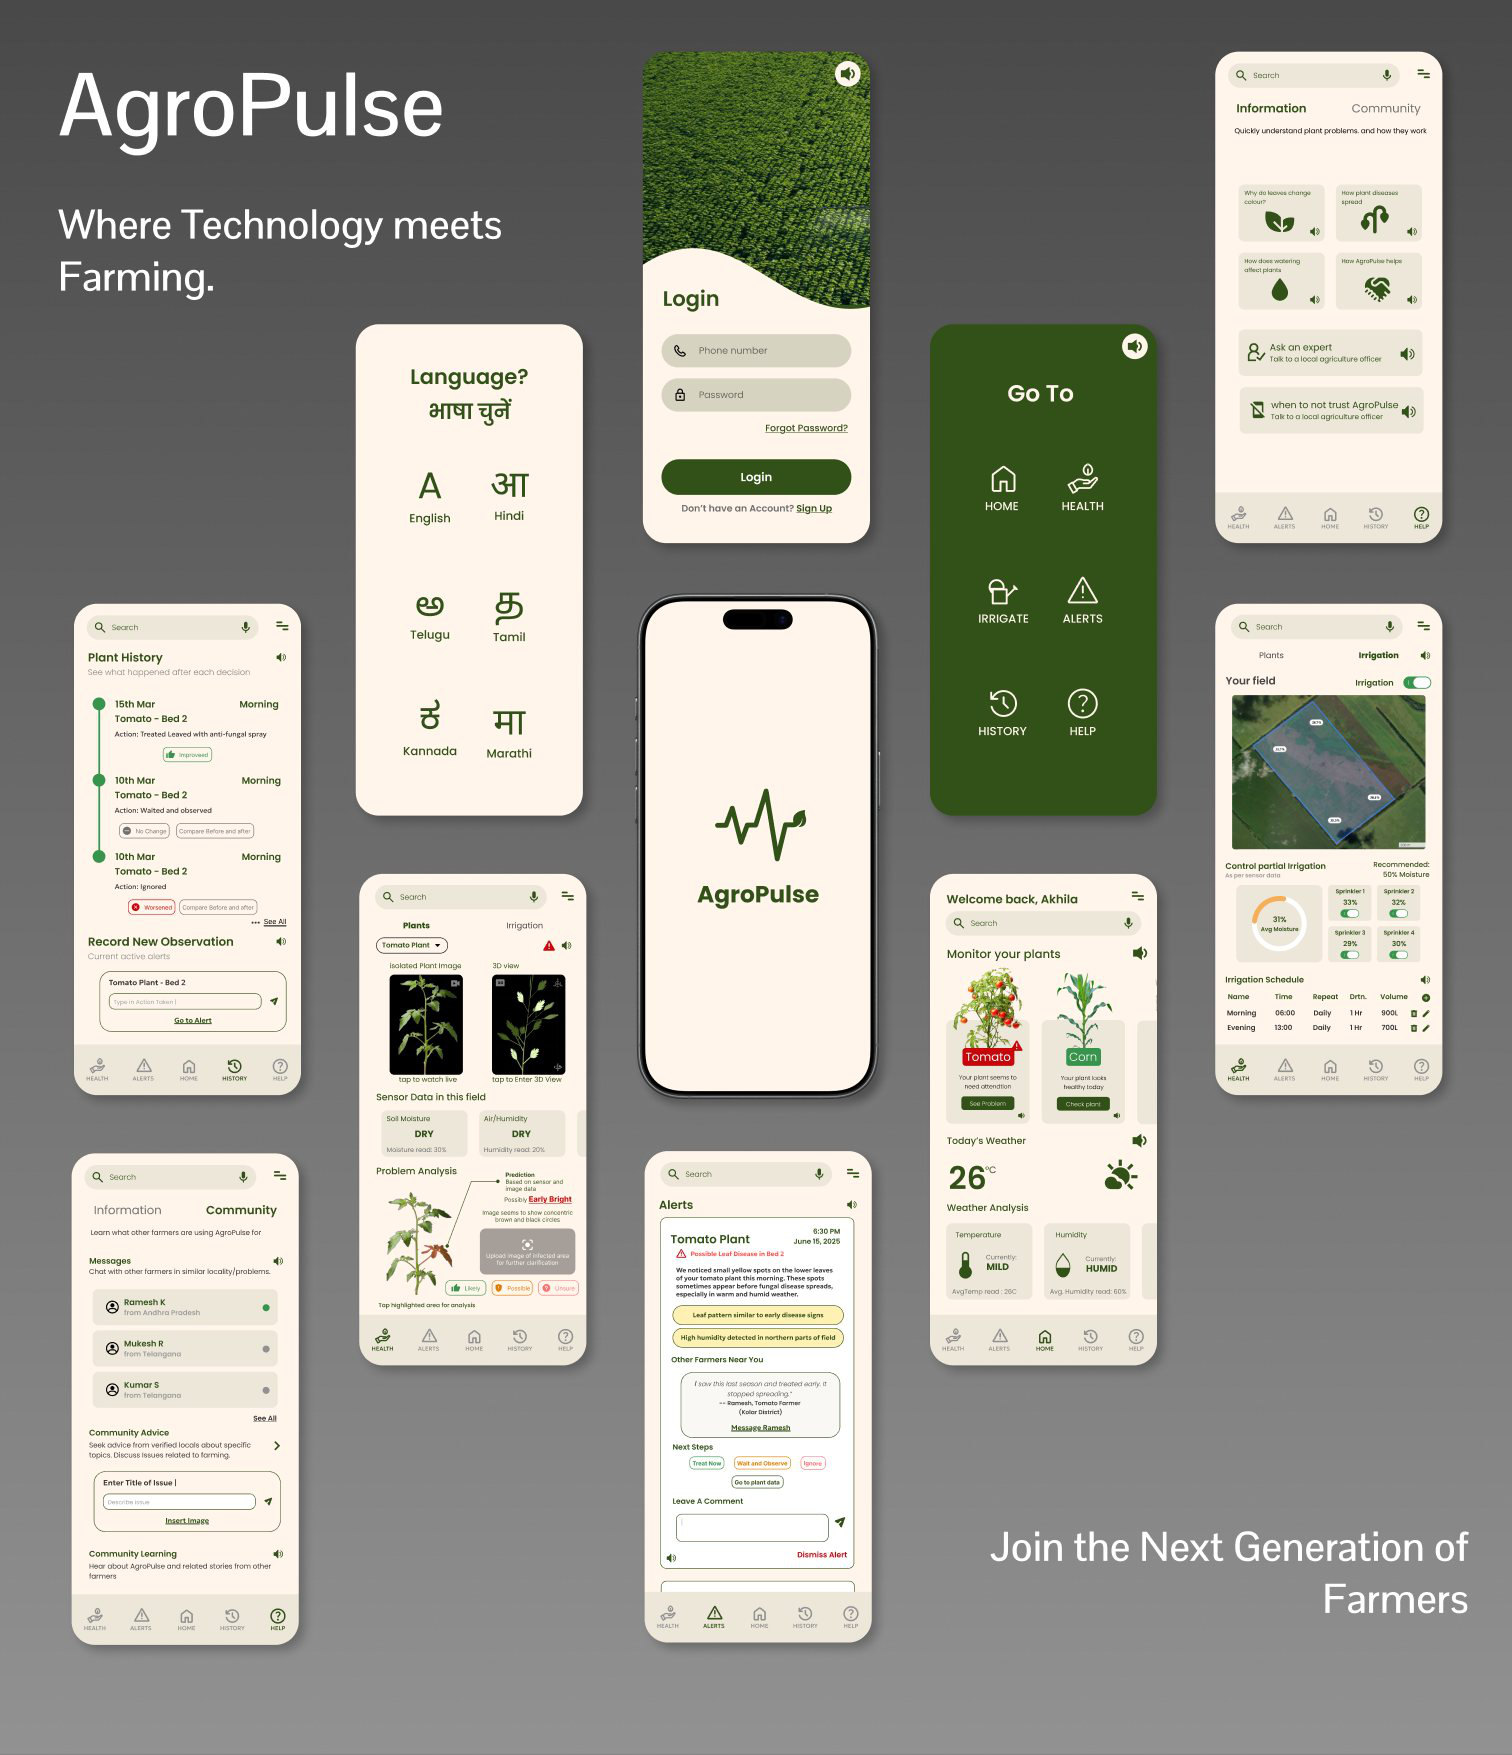
AgroPulse cover: Where Technology meets Farming, with the language, login, Go To, home, health, irrigation, alerts, history and community screens laid out around the AgroPulse splash screen.

Product AgroPulse

AgroPulse is a plant-monitoring system for small-scale farmers. Field sensors and a low-cost camera feed an AI model that looks for crop disease, and the app explains what it found with pictures, plain language and audio, leaving the final decision to the farmer.

Details

Mobile app · field sensors · disease-detection model
surface
UX and system designer, UX researcher
my role
Figma ∙ UX research methods ∙ TouchDesigner ∙ Google Colab
tools
Agriculture · IoT + AI + HCI
domain

Problem Predictions farmers can’t check

AI can flag crop disease early, but farmers with little digital experience distrust a prediction they can’t see or question, and acting on a wrong one can cost a crop.

Solution Explain, then recommend

Every alert shows where on the plant the problem is, why the system thinks so, and what other farmers did, then offers options. Irrigation can always be switched to manual.

Result A working system and prototype

A high-fidelity app, a sensor and camera setup, and a disease model that combines images with sensor data. Scenario walkthroughs and informal usability testing guided the final design.

95.56%accuracy when the model combines images with sensor data
83.67%accuracy from images alone, on the same test set

Who it’s for

The people deciding on plant health are small-scale farmers, often with little digital experience.

Our primary users are small-scale farmers and the farm operators responsible for plant-health decisions. Agricultural extension officers, community farming groups and cooperative managers could use it later.

Four constraints shaped everything: limited experience with digital interfaces, a preference for visual cues over numbers, unreliable internet in the field, and mistakes that can mean losing a crop.

Research

Farmers want advice they can judge, not automation that decides for them.

Farmers were hard to reach, so most of our information was second-hand. We compared existing smart-agriculture dashboards, ran interpretation sessions on second-hand interviews, reasoned through real farming decisions as scenarios, and studied irrigation and crop-disease workflows.

Farmers want advice, not automation. Full automation lowers trust; they prefer recommendations they can evaluate. Pictures beat numbers. Colour, shape and imagery communicate faster than charts. Unexplained AI feels unreliable. Farmers distrust predictions that don’t show why. Control builds confidence. Manual override makes a system easier to accept.

The question

How might we make AI crop predictions something farmers can understand, trust and control?

Design principles

Farmers expressed seven fears of new technology. We turned them into five rules.

The fears were black-box AI, losing control, high-stakes risk, low digital and technical literacy, information overload, no proof that others use it, and generic advice.

Explain before you predict. Show, don’t calculate. Recommend, don’t enforce. Design for low literacy by default. Always show the system’s status clearly.

The system

Sensors and a cheap camera in the field, processing on the device.

Soil moisture, temperature and humidity sensors and a low-cost camera collect data in the field. An ESP32 microcontroller gathers the readings, captures live footage, does basic processing and manages connectivity, so the system keeps working when the internet drops.

The circuit was simulated in TinkerCad before being built with real sensors.
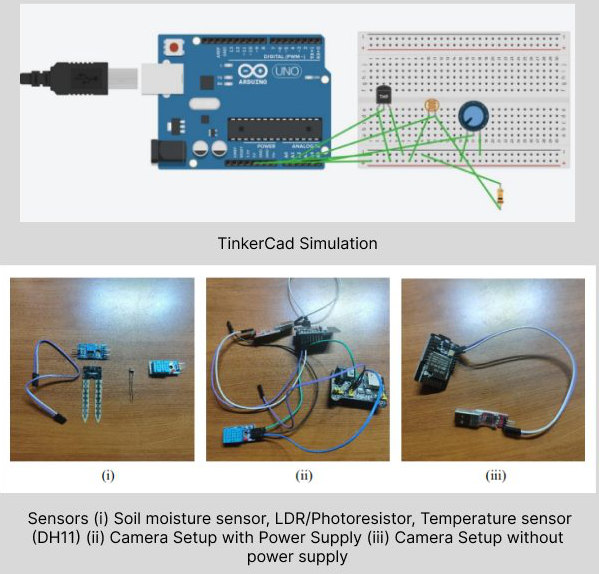
TinkerCad simulation of an Arduino circuit, and photos of the soil moisture sensor, light sensor and DHT11 temperature sensor, and the camera setup with and without a power supply.

The TinkerCad simulation, then the sensors and camera setup.

The model

Images alone weren’t enough. Adding sensor data made predictions reliable.

The model first cleans up footage from cheap cameras (less noise, even lighting, better contrast), then isolates the leaves from sky, soil and shadow. That isolation is what lets the app highlight exactly where a problem is.

Disease detection then combines what the camera sees with the field conditions. On our test set, the combined model reached 95.56% accuracy, against 83.67% for images alone and 25.22% for sensor data alone, which cuts down false alerts.
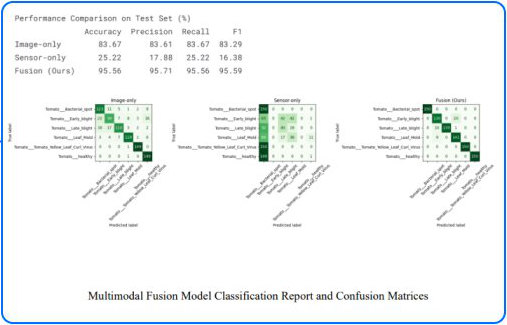
Performance comparison on the test set: image-only 83.67% accuracy, sensor-only 25.22%, fusion 95.56%, with confusion matrices for each.

Classification results and confusion matrices for image-only, sensor-only and combined models.

Design system

Earthy colours and one friendly typeface, so the app feels familiar outdoors.

Everything sits on a warm cream ground with deep greens for actions, so the app looks like the field rather than a dashboard. Orange and red are kept for warnings, so they stand out when something needs attention.

Colour

Sampled from the final screens. Greens carry navigation and actions; orange means “possible problem” and red means “act now”.

Cream#FFF5EB · background Sand#EDE7D9 · cards, inputs Field green#325118 · buttons, Go To Leaf#386D43 · accents Orange#DE7C01 · possible issue Red#FF4F51 · alerts

Type and icons

Poppins in three weights for everything, so text stays round and easy to read. Icons come from the Iconify plugin in Figma, and every section has a speaker icon for audio.

Monitor your plants

Poppins · regular, medium, bold

From research to design

Each screen answers one of the farmers’ fears.

These are the main screens of the final design and the research each one responds to.

Low literacy, many languages

The first thing you choose is your language.

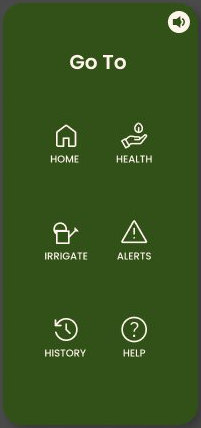
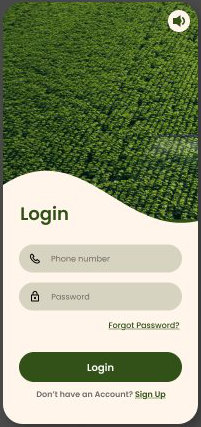
Language selection comes before anything else, in six Indian languages. Login uses a phone number instead of email, since many farmers don’t have an email account. Right after login, a Go To page with six large icons takes you straight to what you need.
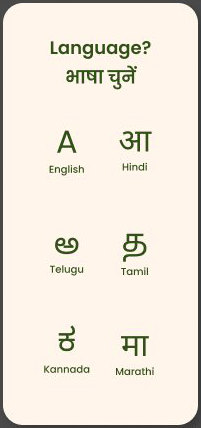
Language picker in English, Hindi, Telugu, Tamil, Kannada and Marathi.
Choose a language
Login with phone number and password over a photo of a green field.
Log in with a phone number
Go To page with large icons for Home, Health, Irrigate, Alerts, History and Help.
Go straight to a section

Show, don’t calculate

Plants that need care come first, in pictures.

Home lists every plant with a short status, and plants that need attention appear first. Weather from the sensors is shown as simple words like Mild and Humid, with the readings underneath.
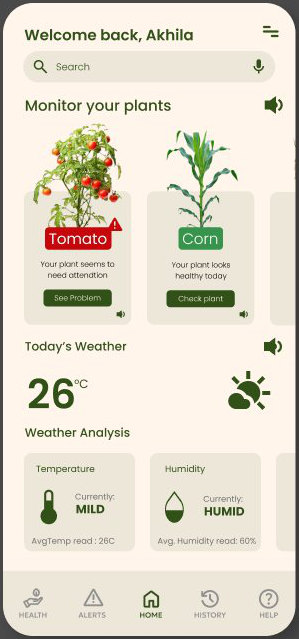
Home: a tomato plant flagged for attention and a healthy corn plant, today's weather and humidity.
Home

Explain before you predict

The app shows where and why, not just what.

The plant’s health page shows live footage and a 3D view of the plant, the sensor readings for its bed, and the prediction with how sure the model is (Likely, Possible or Unsure). Tapping the highlighted area explains what the camera saw, and you can upload your own photo for a second look.
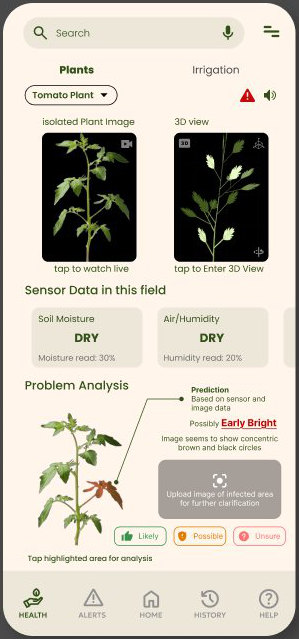
Plant health: live footage, a 3D view, sensor data showing dry soil and air, and a problem analysis predicting early blight with Likely, Possible and Unsure options.
Plant health

Recommend, don’t enforce

Alerts give reasons, other farmers’ experience and a choice.

An alert describes what was noticed and why it matters, quotes nearby farmers who saw the same thing, and offers next steps: Treat now, Wait and observe, or Ignore. Farmers can reply or leave a comment.
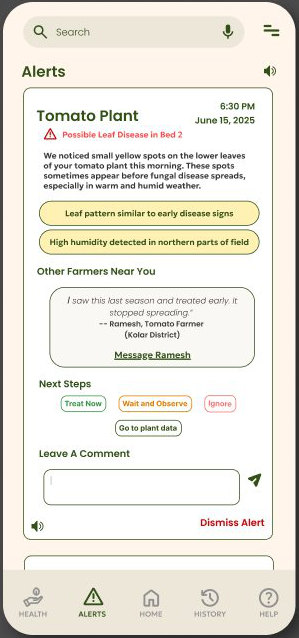
Alert for a possible leaf disease in a tomato bed, with reasons, a comment from another farmer, and Treat Now, Wait and Observe and Ignore options.
Alert

Control equals confidence

The farmer can always take over.

Irrigation can be switched on or off for the whole field, each sprinkler can be controlled on its own, and schedules can be edited. The app recommends a moisture level but never forces it.
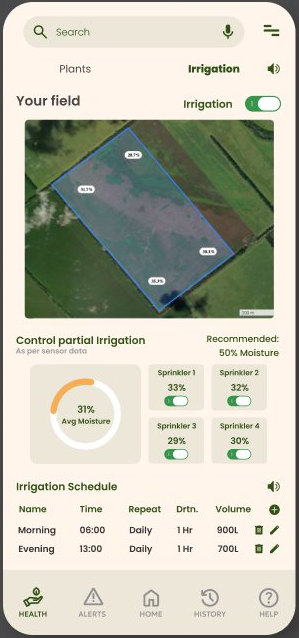
Irrigation: a satellite view of the field, an irrigation toggle, per-sprinkler moisture and switches, and an editable schedule.
Irrigation

Build trust over time

Farmers can see what happened after each decision.

Plant History records each action taken and whether the plant improved, stayed the same or got worse. Farmers can also log their own observations. The Help tab adds plain-language guides, an expert to ask, and a community of local farmers.
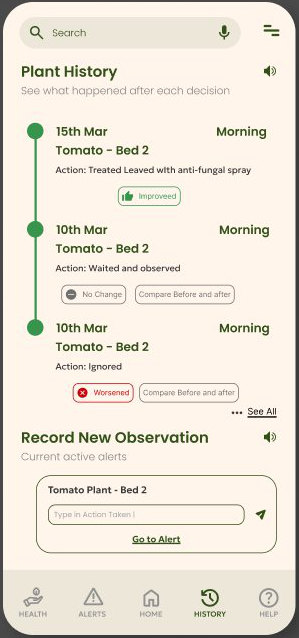
Plant History timeline with actions and outcomes (Improved, No change, Worsened) and a form to record a new observation.
Plant history

Accessibility

Accessibility was the main design requirement, not a final check.

Language selection, a clear visual hierarchy with icon-assisted navigation, audio assistance for farmers who can’t read, and as little numeric or technical language as possible.

Evaluation

Seeing the reasoning made people trust it.

We walked through scenarios (a disease detected, a false positive, a manual irrigation override), ran informal usability tests, and watched for confidence and hesitation at each decision.

Visual explanations increased trust, the 3D plant view helped people understand the disease, and manual override reduced fear of automation.

Reflections

What workedExplainable AI improved trust, visual-first design lowered the learning barrier, and manual control made people more willing to adopt it.

ChallengesBalancing simplicity with useful feedback, designing for unpredictable outdoor conditions, and avoiding automation bias so farmers keep the choice.

NextStop judging a whole field from one plant, let farmers engage further so AgroPulse grows into a community, and improve the model’s accuracy and precision.
Making enterprise software easier to find and use

Enterprise SaaSWeb and mobileInternal IT platform

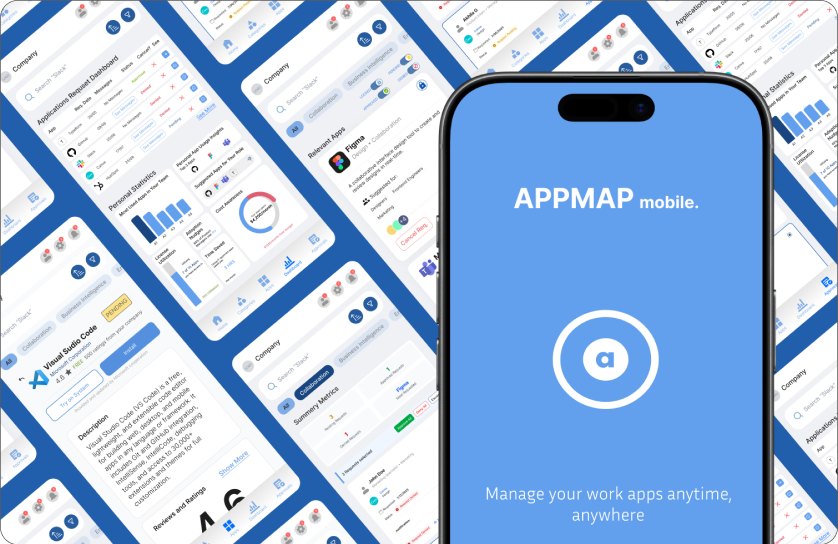
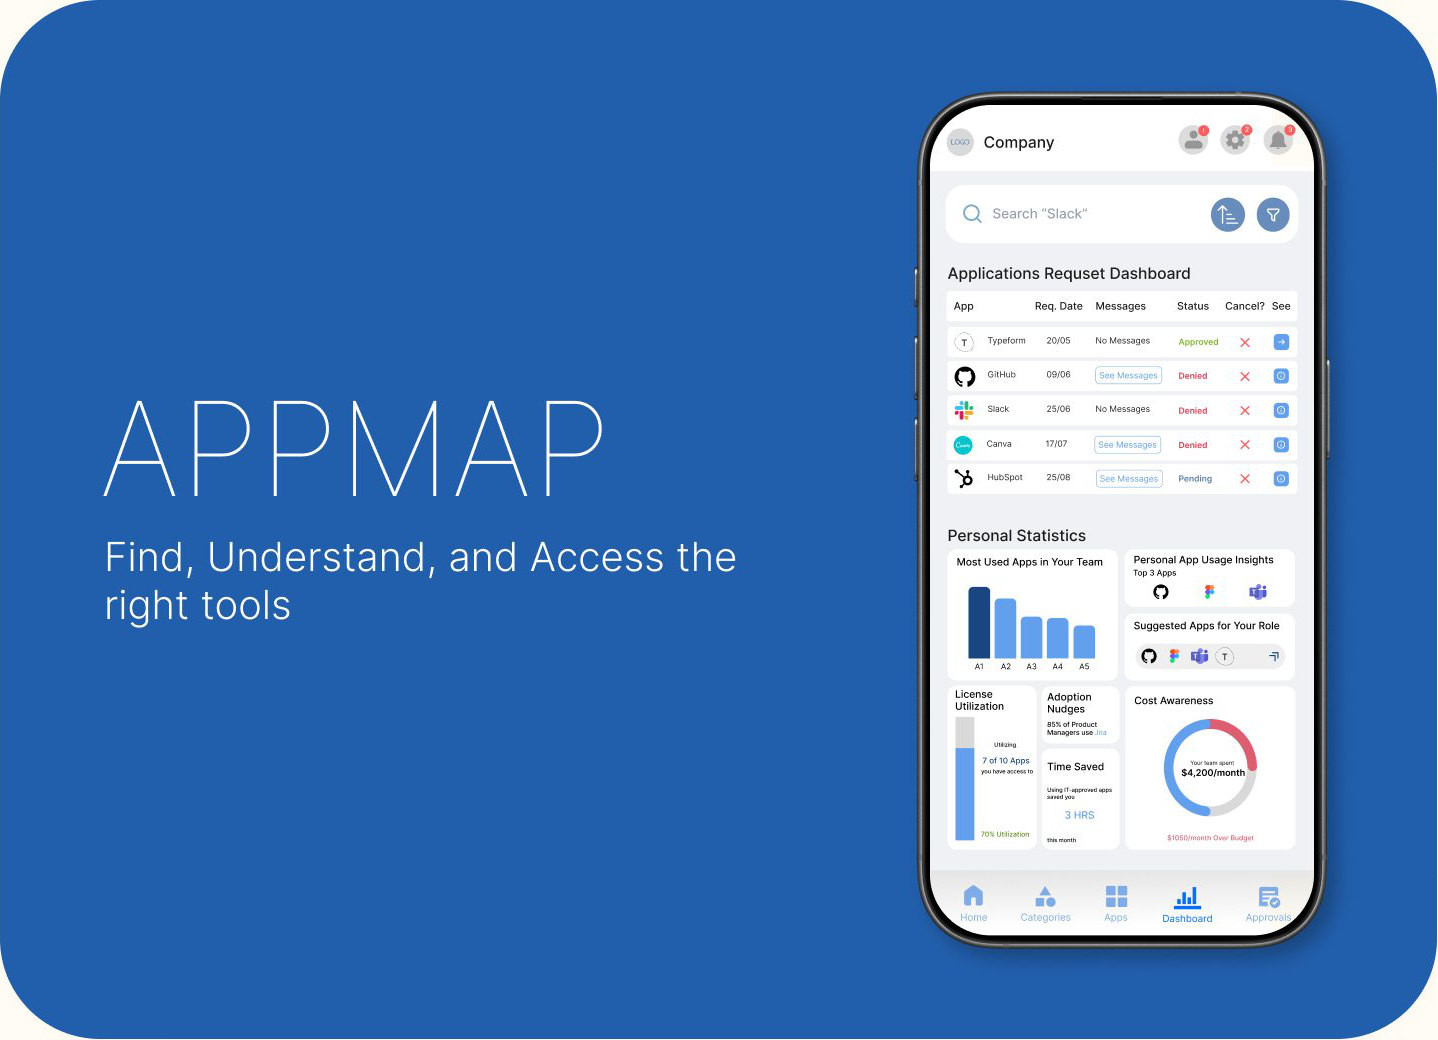
APPMAP cover: Find, Understand, and Access the right tools, next to a phone showing the application request dashboard and personal statistics.

Product APPMAP

APPMAP is an employee app catalog I designed for a case study from Zluri. Employees browse, request and launch the approved apps they need, track their requests, and see what their team uses. Managers and IT approve requests in the same system.

Details

Zluri case study · employee app catalogue
brief
Web dashboard · mobile app
surface
Product designer, UX researcher
my role
Market research ∙ Information architecture ∙ User flows ∙ Hi-fi web and mobile screens ∙ Success metrics
my scope
Figma ∙ UX research methods
tools
Enterprise SaaS · internal IT platform
domain

Problem The wrong way to look for apps

Employees know what they need to do, not which app does it. Catalogs are sorted by app name, give no reason to trust an app, and requests disappear with no status.

Solution Browse by task, see every status

A catalog organised by team, role, use case and access type, with clear app states, team usage, and a request flow you can follow from submission to approval.

Result Designs for three user types

High-fidelity web and mobile screens for employees, managers and IT, with success metrics defined for launch. Moderated usability testing is the next step.

4enterprise app catalogs analysed: Microsoft AppSource, Google Workspace Marketplace, Okta and AWS Service Catalog
3user types served by one catalog: employees, managers and IT

The problem

Employees know what they need to do, not which app does it.

Without an easy internal catalog, employees waste time looking for approved apps, submit the same access request again and again, and fall back on unofficial tools (shadow IT). That frustrates both employees and IT, and creates compliance risk.

They can’t find it. Catalogs are sorted by app name, but people think in tasks and roles. They don’t trust it. With no approval badges, usage or cost information, people hesitate to request. They can’t track it. Requests disappear into a black box with no status or timeline.

Who it’s for

One catalog for three kinds of user, each needing something different.

Employees (new hires, people switching roles, existing staff) need to find and get the right tools fast. Managers need to approve requests with the right context. IT and admins need access to stay compliant and auditable.

The question

How might we make discovery effortless for employees without giving up IT control?

Market research

I studied four enterprise catalogs as both a product manager and a designer.

As a product manager I looked at workflows, approvals and business goals. As a designer I looked at how easy it is to find and use apps. Each catalog did one thing well that APPMAP could borrow.

Microsoft AppSource

Works: grouping apps by category makes the relevant ones surface when you need them, and Buy and Trial buttons make trying an app easy.

Falls short: little personalisation; it feels built for buyers, not employees browsing.

I took: show apps relevant to your department, and let people try an app before requesting it, so they don’t test unapproved tools on the side.

Google Workspace Marketplace

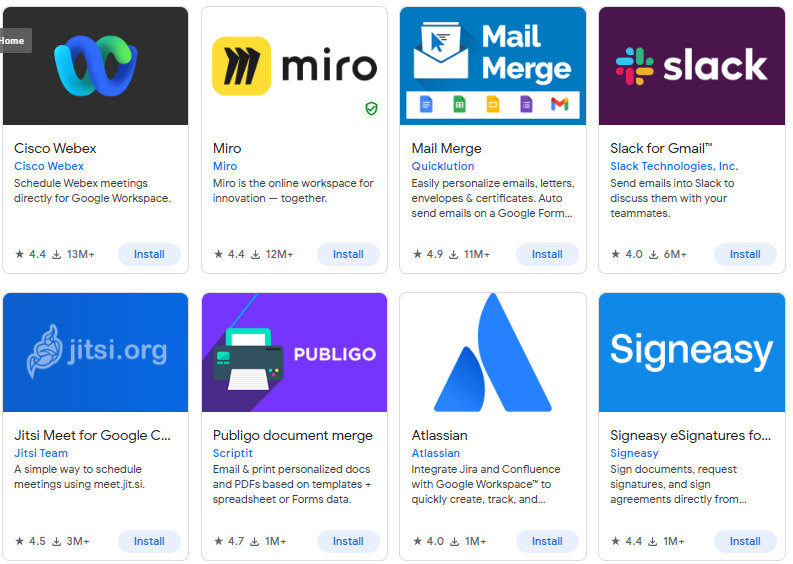
Works: a clean card layout with clear Install and Installed states, ratings and reviews up front, and one-click installs once approved.

Falls short: the catalog is huge, with no answer to “which apps are useful for my role?”

I took: clear app states, admin bulk provisioning for whole teams, and ratings and privacy details on every app.

Okta dashboard

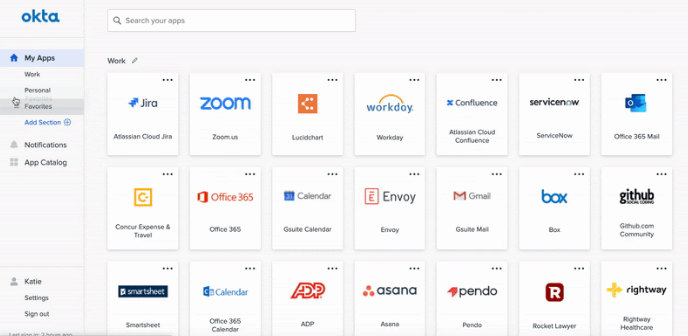
Works: a simple grid of app tiles you launch in one click, kept secure for IT.

Falls short: built for access, not discovery: no recommendations, no context, little detail on the cards.

I took: one place for every app, plus “recommended for you” and “trending in your company”, and enough information on each card.

AWS Service Catalog

Works: self-service that stays inside governance, with role-based access and approved versions.

Falls short: assumes technical knowledge; it feels like a deployment form, not a store.

I took: show version, owner, cost and security approvals for technical tools, and keep technical workflows apart from the everyday catalog.

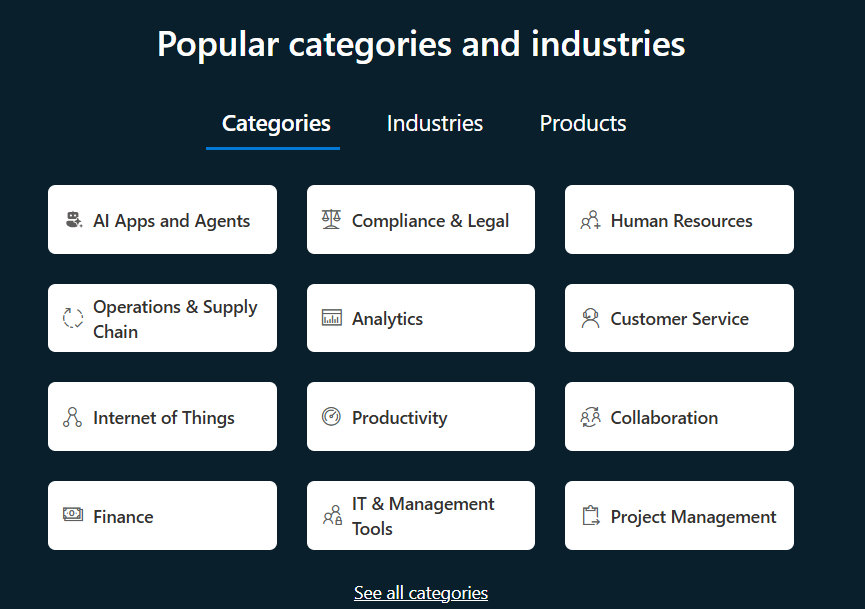
Microsoft AppSource: popular categories and industries such as Analytics, Collaboration, Finance and IT and Management Tools.
Google Workspace Marketplace: app cards for Webex, Miro, Mail Merge and Slack with ratings and install counts.
Okta end-user dashboard: a grid of app tiles such as Zoom, Workday, Office 365 and GitHub.

Microsoft AppSource, Google Workspace Marketplace and the Okta dashboard, from my market research.

Pain points

Across these products, seven pain points kept coming up.

Discovery: employees don’t know which apps exist or which suit their role. Information: app pages lack purpose, cost and compliance details. Request friction: requests are slow, repetitive and opaque. Tracking: there’s no single place to see installed apps or request status. Categories: apps aren’t grouped logically, so browsing is overwhelming. Approvals: managers lack context, bulk actions and audit trails. Experience: existing portals feel outdated, impersonal and hard to use on mobile.

Design goals

Five goals kept the design simple for employees and safe for IT.

Reduce cognitive load during discovery. Support exploratory browsing without overwhelming people. Make status and approval flows transparent. Make it accessible and inclusive for every employee. Keep IT governance without exposing technical complexity.

Information architecture

After signing in, everything is one tap from five tabs.

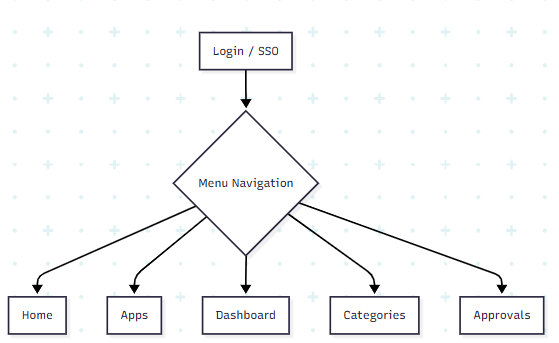
Home holds installed apps to launch, IT announcements and highlights. Apps is the catalog, with search, filters and a detail page for every app. Categories groups apps by role, team, function and access type. Dashboard tracks your requests, onboarding and usage. Approvals is where managers and IT review requests.

An admin view for usage reports, licence tracking, cost and adding or removing apps is planned but not yet designed.

App structure: Login or SSO leads to menu navigation, which branches to Home, Apps, Dashboard, Categories and Approvals.

The top level of APPMAP’s structure.

User scenarios

I walked the structure through three everyday situations.

A new employee opens the dashboard, installs everything on their role’s onboarding list until it reaches 100%, then browses by role and requests anything else. Their manager approves it and it appears in their apps.

An existing employee needs an analytics tool, searches “data visualization” or browses Categories, compares Tableau and Power BI on their detail pages, requests one, and follows the approval on the dashboard.

Someone switching teams, from Marketing to Product, gets a fresh onboarding list. Old marketing apps are flagged as no longer relevant, with the option to keep or uninstall them, and they request Jira and Confluence.

Design system

A calm corporate blue, with one colour for each request status.

Navy and blues carry the interface. Green, yellow and red are kept for app and request states (approved, pending, denied), so status reads at a glance.

Colour

Sampled from the final screens.

Navy#194681 · sidebar, headings Blue#62A0ED · buttons, charts Mist#E0EAF6 · background, chips Green#82B82E · approved, install Yellow#FFCC00 · pending Red#E43D5B · denied, cancel

Type and icons

Inter in three weights for everything. Icons come from the Iconify plugin in Figma: search, people, lock, hourglass and shield stand for the core ideas of finding, teams, access, waiting and approval.

Showing Relevant Apps

Inter · regular, bold, black

Badges and buttons

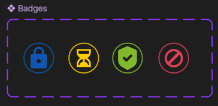
Four status badges (locked, pending, approved, denied) appear on every app card. Buttons change with the app’s state, so the label always says what will happen: Request Access, Install, Approval Pending, Request Denied, Cancel.

Four status badges: a blue lock, a yellow hourglass, a green shield with a tick and a red no symbol.
Status badges
Button states for requesting access, cancelling, installing, approval pending, request denied and access disabled.
Button states

From research to design

Each screen answers one of the three problems.

These are the main screens of the final design and the problem each one responds to.

Can’t find it

Apps show who they’re for and what state they’re in.

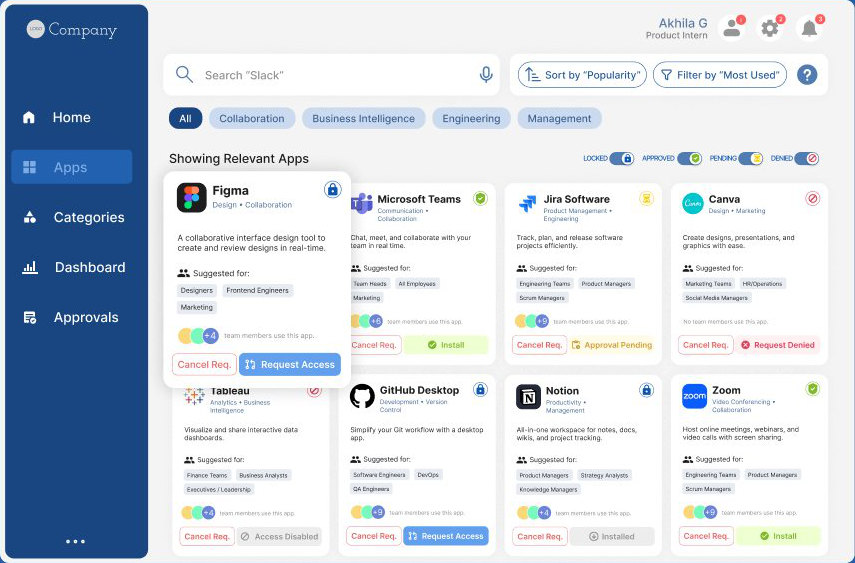
The Apps tab is a card grid for quick scanning. Each card shows the app’s state (installed, available, requestable or pending), who it’s suggested for, how many teammates use it, and one clear action: Launch, Request or Cancel.

Filters cover role, team, app function, tags like “Recommended for your role”, cost and licence type, and security and compliance. You can sort alphabetically, by usage in your team, by rating, by cost, or by access status. Search, settings, notifications and a help button stay in the header on every screen.

Apps screen: a sidebar, search with sort and filter, category chips, status toggles, and a grid of app cards like Figma, Microsoft Teams, Jira and Canva with Request Access, Install and Approval Pending actions.

People think in teams and tasks

Browse by team, role, use case or access type.

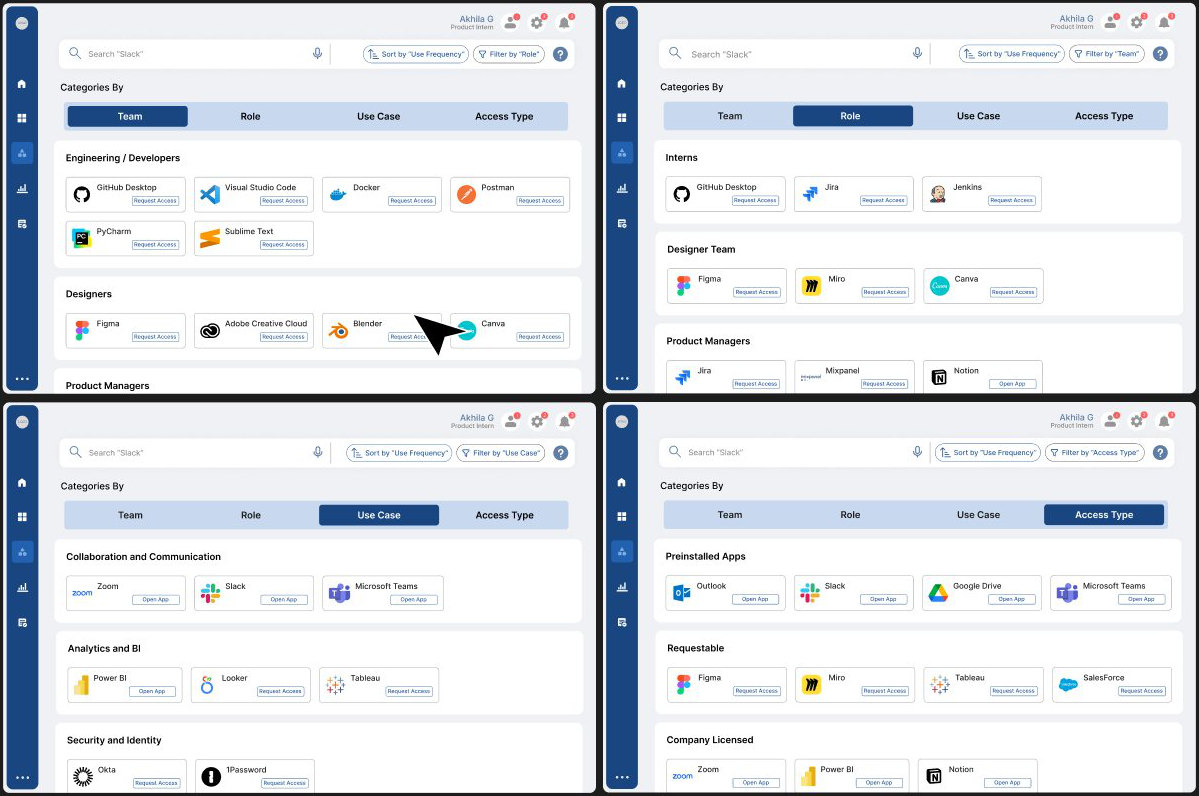
Employees often know only their role, team or task, not an app’s name. Categories lets them explore from any of those four starting points instead of relying on search.

Four views of the Categories screen, grouped by Team, Role, Use Case and Access Type.

Don’t trust it

App details answer “is this safe, and do people use it?”

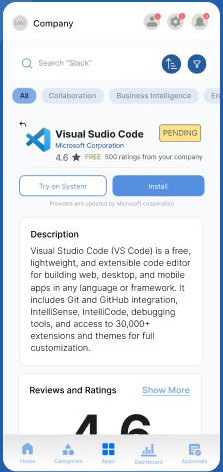
Each app page shows a description, ratings and reviews from colleagues, screenshots, trust and governance information (access status, approval time, security, cost), how much of the company uses it, and similar apps.

Mobile app details for Visual Studio Code: pending status, rating 4.6, Try on System and Install buttons, and a description.
App details on mobile

Can’t track it

Every request shows exactly where it is.

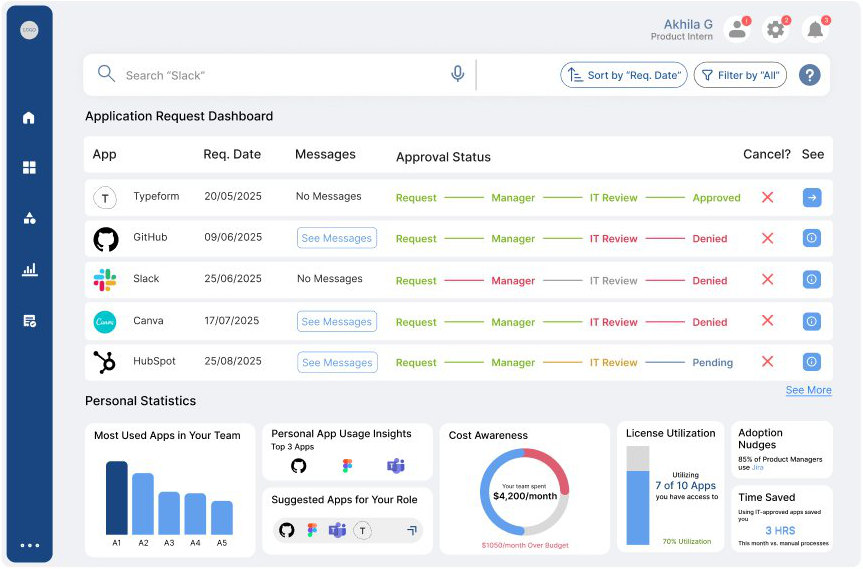
The Dashboard is a personal control centre. Each request moves visibly from Request to Manager to IT Review to a decision, with messages attached. Below are the team’s most-used apps, suggestions for your role, licence use, time saved and how the team’s spending compares with its budget.

Dashboard: an application request table with a Request, Manager, IT Review and Approved or Denied progress line for each app, and personal statistics cards.
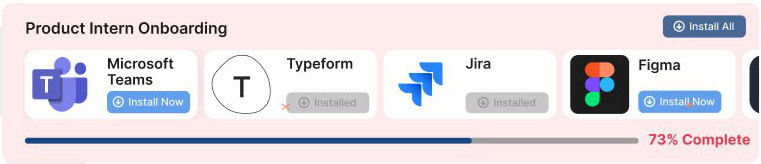
Product Intern Onboarding banner with Microsoft Teams, Typeform, Jira and Figma to install and a 73% complete progress bar.

New employees see an onboarding list for their role and team at the top of the dashboard until it reaches 100%.

Approvals without the black box

Managers and IT get their own workspace.

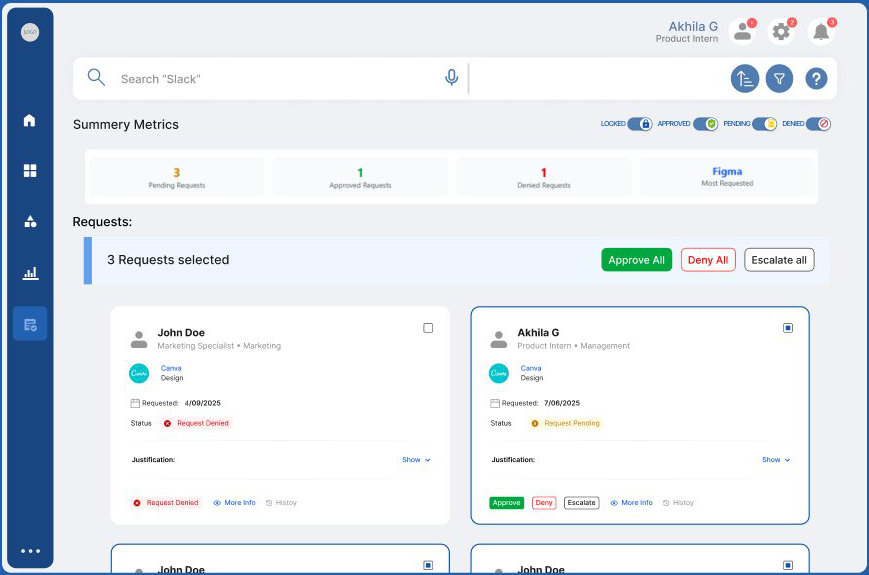
Approving is a different job from browsing, so it has its own tab. A queue shows every pending request with the requester’s role, reason and cost. Managers can approve, deny with feedback, act on several requests at once, or escalate, and every decision is logged for audits.

Approvals screen: summary metrics for pending, approved and denied requests, a bulk action bar, and request cards with Approve, Deny and Escalate buttons.

No mobile version

The same catalog, on your phone.

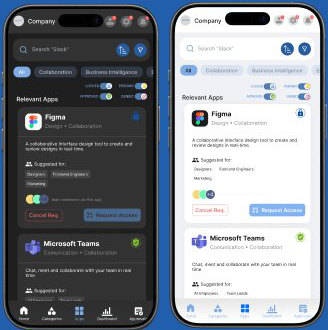
APPMAP mobile carries every tab to a phone, with a high-contrast dark mode.

The Apps screen on two phones, in dark mode and light mode.

Accessibility

Accessibility was a primary design requirement.

A high-contrast interface with dark mode, a clear visual hierarchy with icon-assisted navigation, a help button on every screen, and as little dense text or technical jargon as possible.

Measuring success

I set targets for launch so the catalog can be judged on real use.

These are targets, not results; the catalog hasn’t launched.

40%of employees browse the catalog at least once a month, within 3 months
20%of employees submit at least one request in the first 2 months
30%fewer app-access IT tickets within 3 months
75%+of purchased licences actively used
60%of searches end in a request or a launch
3recommended apps per role, each used by more than half that role

Reflections

What workedRole-based categories made apps much easier to discover, clear app states reduced confusion, and the transparent dashboard made approvals feel faster.

ChallengesBalancing personalisation with governance rules, giving depth without overloading people, and designing for both casual users and decision-makers.

NextRun moderated usability tests with employees and managers, adapt suggestions to each person’s behaviour over time, and explain approval timelines to build more trust.

Finding where the hours go in a survey pipeline built for 13,000+ employees

Industry-sponsored · Bravo17UX research● Ongoing, Aug 2026 – present

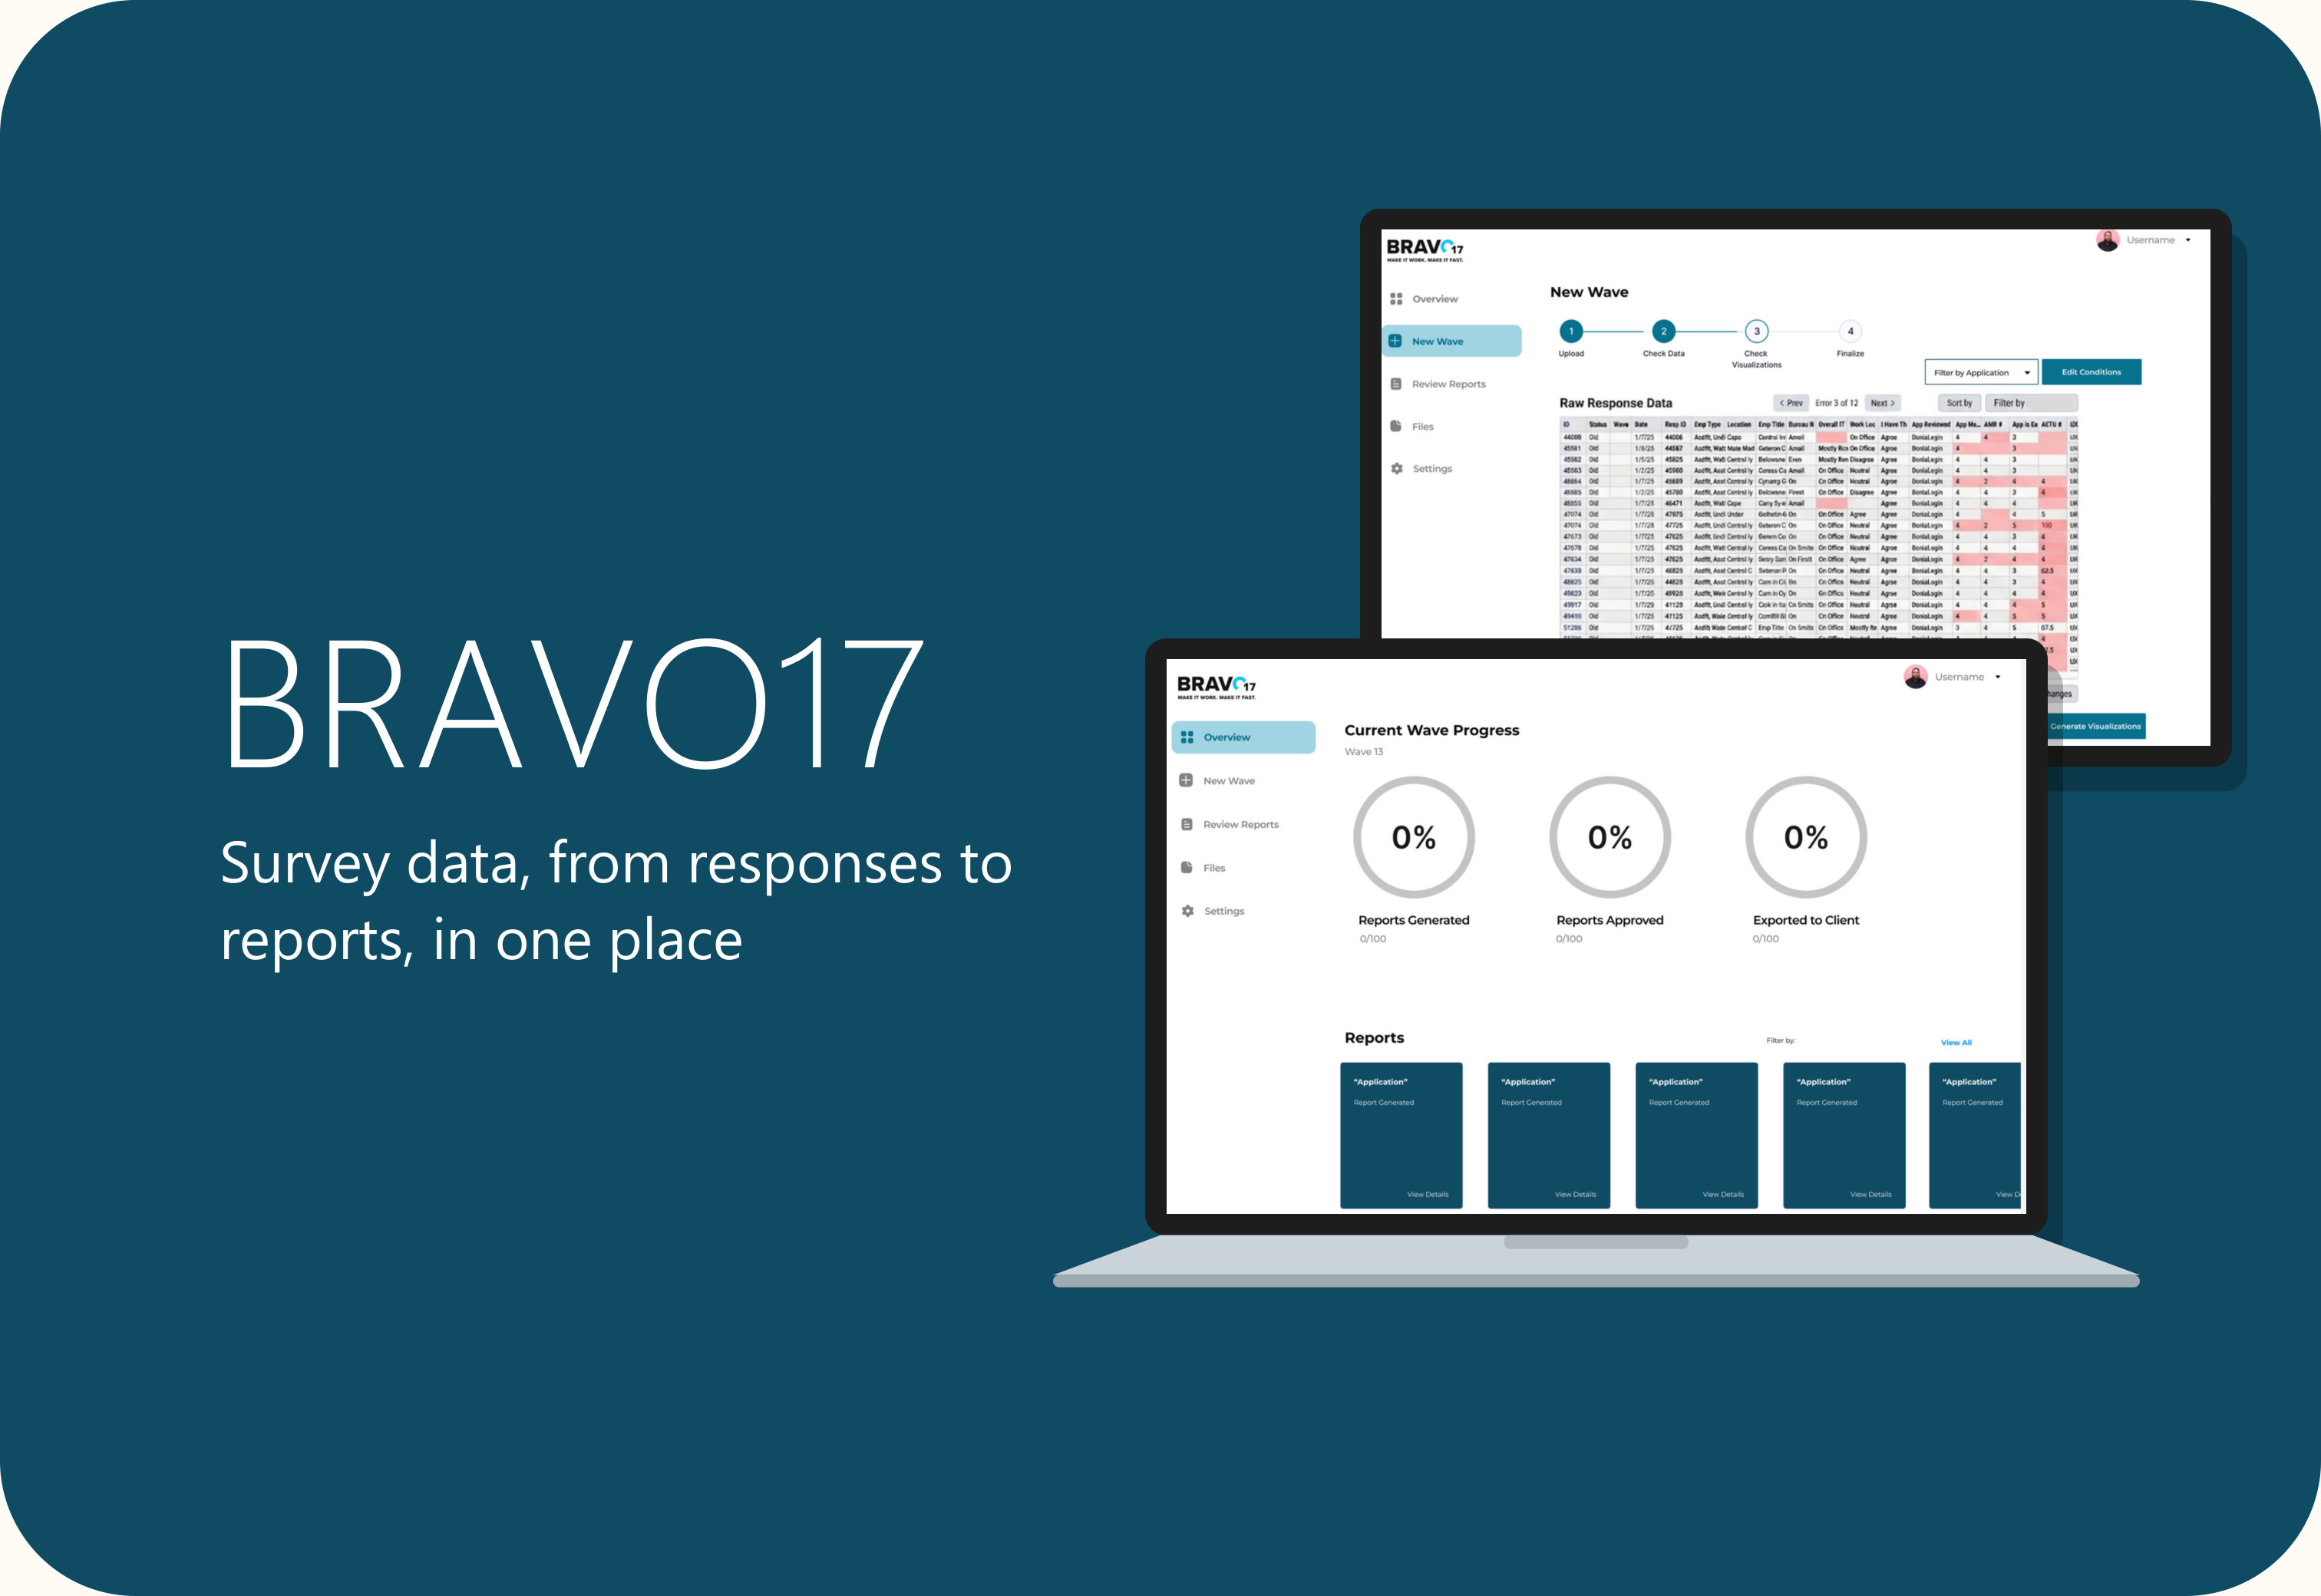
Bravo17 cover: survey data, from responses to reports, in one place. A laptop shows the initial overview wireframe, with the check-data step and its flagged rows behind it.

Project Bravo17 survey pipeline

An industry-sponsored project with Bravo17 (B17), a digital consultancy that builds user-centred systems for federal agencies. Bravo17 surveys Department of State employees about the applications they use, then turns the responses into a report for every application team. Our team is researching that pipeline and designing a system to make it faster and less tedious.

Details

Industry-sponsored project with Bravo17 (B17)
sponsor
UX researcher · comparative analysis lead · session moderator
my role
eama-zing!: Echo O’Connor, Ananya Bhide, Mikaela Castillo and me
team
Contextual inquiry ∙ Interviews ∙ Expert interview ∙ Survey ∙ Comparative analysis ∙ Concept testing ∙ Wireframes
methods
PSYC 6023 Research Methods for HCI, Georgia Tech
course

Problem Hours of manual work per cycle

Four employees turn each survey’s responses into 40+ Excel reports by hand: about eight hours per cycle, plus three to four hours of review. The number of application teams is about to pass 100.

Direction One dashboard for the pipeline

A dashboard that brings every stage together: upload a survey wave, check the data automatically, flag errors, review and approve reports, then export them to application teams.

Status Final prototypes in progress

Research is complete, two rounds of concept testing and a wireframe session are done, and our final prototypes are currently being made.

40 → 100+application reports per survey cycle
~8 hrsto process one cycle by hand, before 3–4 hours of review

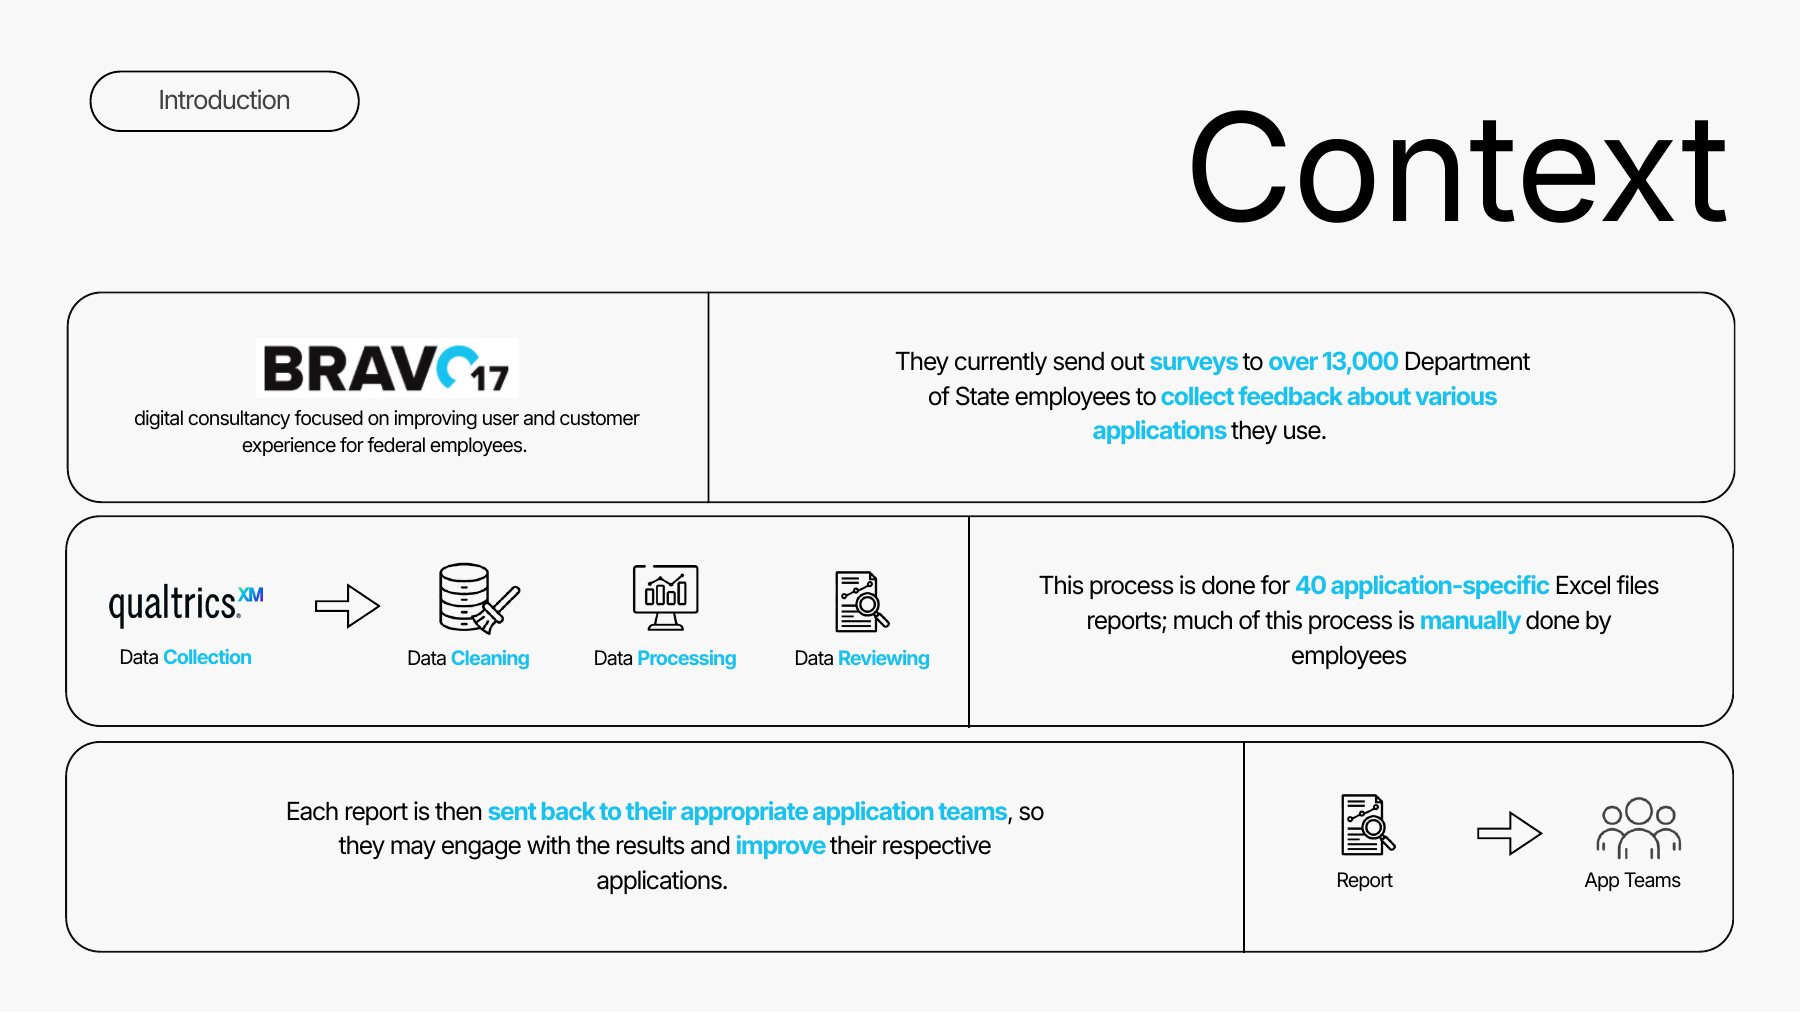
Context

Every two months, survey responses become 40+ reports, mostly by hand.

The survey goes to more than 13,000 Department of State employees and stays open for about two weeks. Responses land in a Qualtrics instance owned by Bravo17’s client, so only one team member can export the data, as a CSV file.

From there it’s cleaned in Excel, split by application, turned into a report for each team (a cover page of key metrics, a comment keyword analysis and the full data), reviewed by a second person, uploaded to agency folders, and emailed to each application team. Bravo17 has run this process for about two years.

Context: Qualtrics data is collected, cleaned, processed and reviewed before each report goes back to its app team.
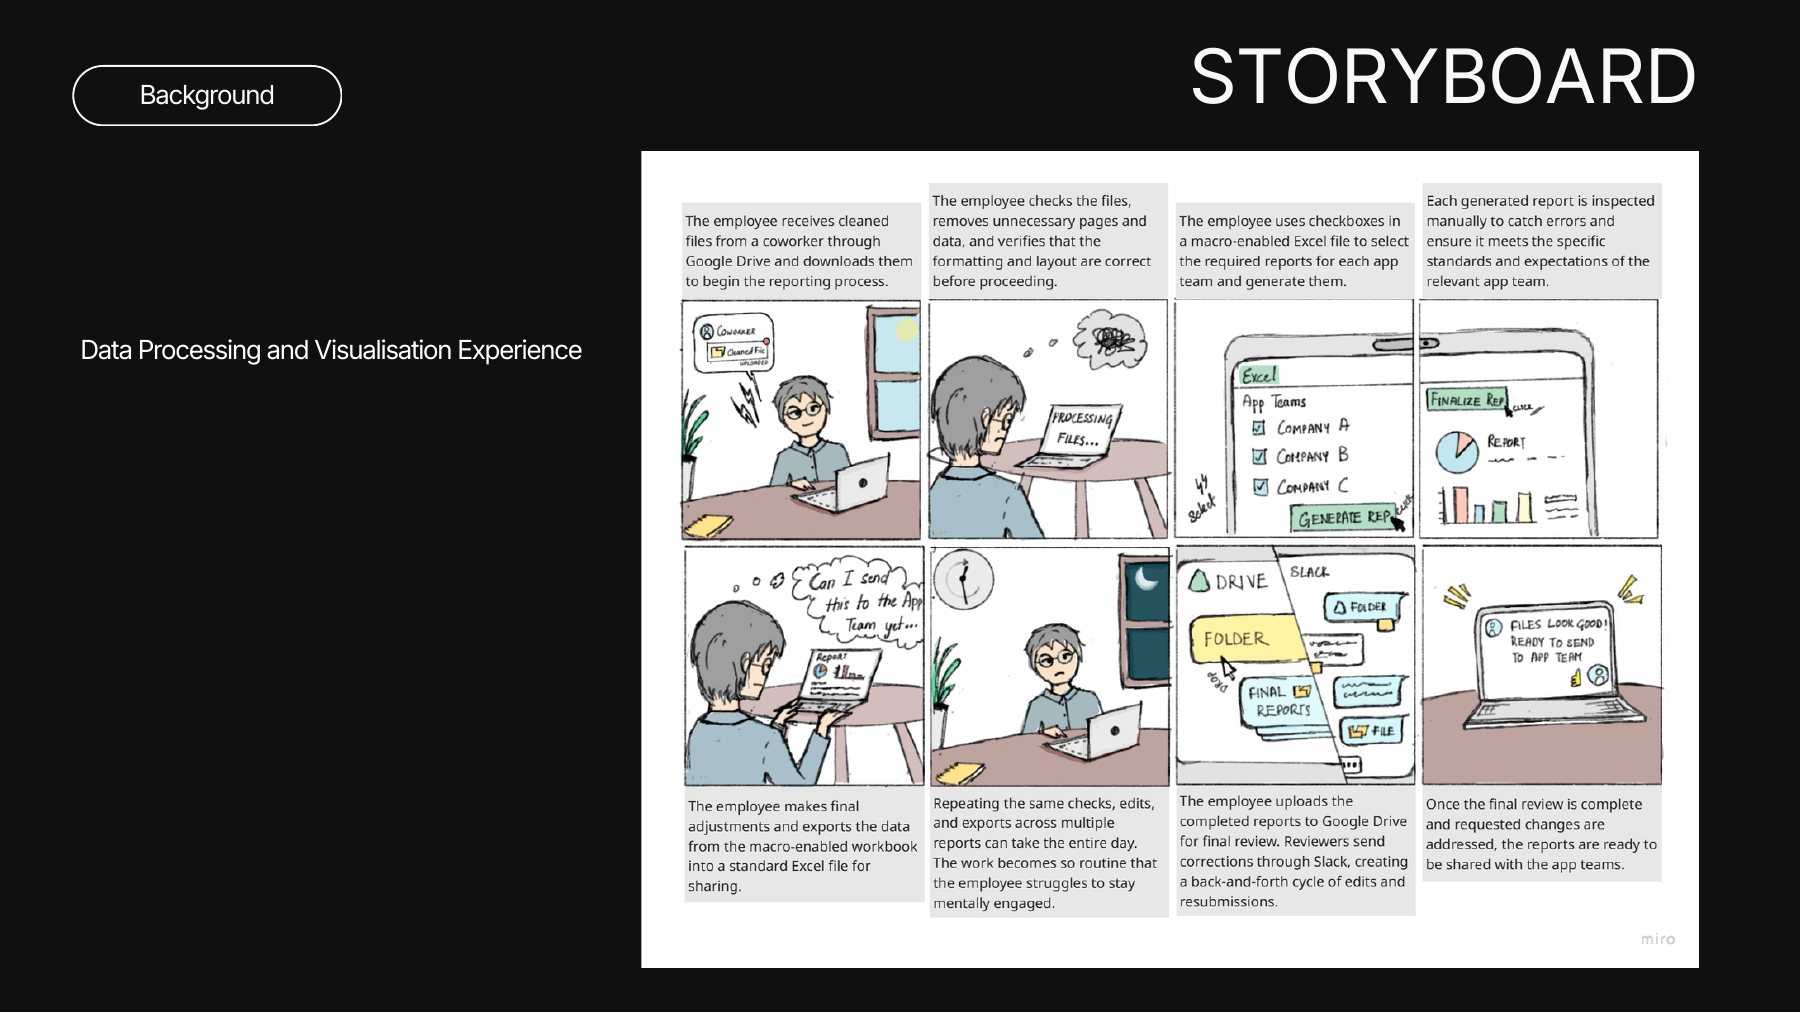
Storyboard of the current workflow: an employee downloads cleaned files, checks them, generates reports with a macro-enabled Excel file, inspects each report, exports, repeats for hours, uploads to Google Drive, fixes review comments from Slack, and shares reports with app teams.

Storyboard of today’s workflow: one employee repeats the same checks, edits and exports across dozens of reports.

Why it matters

Preparing data is the most time-consuming part of data work everywhere, not just at Bravo17.

Data preparation takes about 80% of data scientists’ work, and cleaning alone about 60% of their time (Press, 2016). A 2020 survey still put it at around 45% (Anaconda, via Amperity, 2026). Poorly designed reports can then overwhelm the people who receive them (Yigitbasioglu & Velcu, 2012).

Self-service business intelligence in the 2010s let people reach clean data directly instead of waiting for one person’s manual cycle. Bravo17 wants to make the same shift, and is especially interested in better automation and an internal dashboard where application teams can see their reports.

Who it’s for

The people doing the work are a small processing team; their reports serve many more.

Primary users: Bravo17’s survey data processing team, who clean, process, visualise, check and review every report. Secondary users: the application teams who receive the reports and act on them.

Other stakeholders include Bravo17’s executives and team leads, the project managers who send the survey, Department of State leadership and survey respondents, and the Qualtrics team.

The question

How might we improve the efficiency and experience of Bravo17 employees working with the survey data processing pipeline?

Research

Five methods, each building on the last.

We watched the work first, asked why second, then checked what the rest of the industry does. All sessions used mock data, since the real survey data is sensitive.

4employees studied in depth
1data-engineering expert interviewed
23complete survey responses analysed
40tools compared across 9 pipeline stages

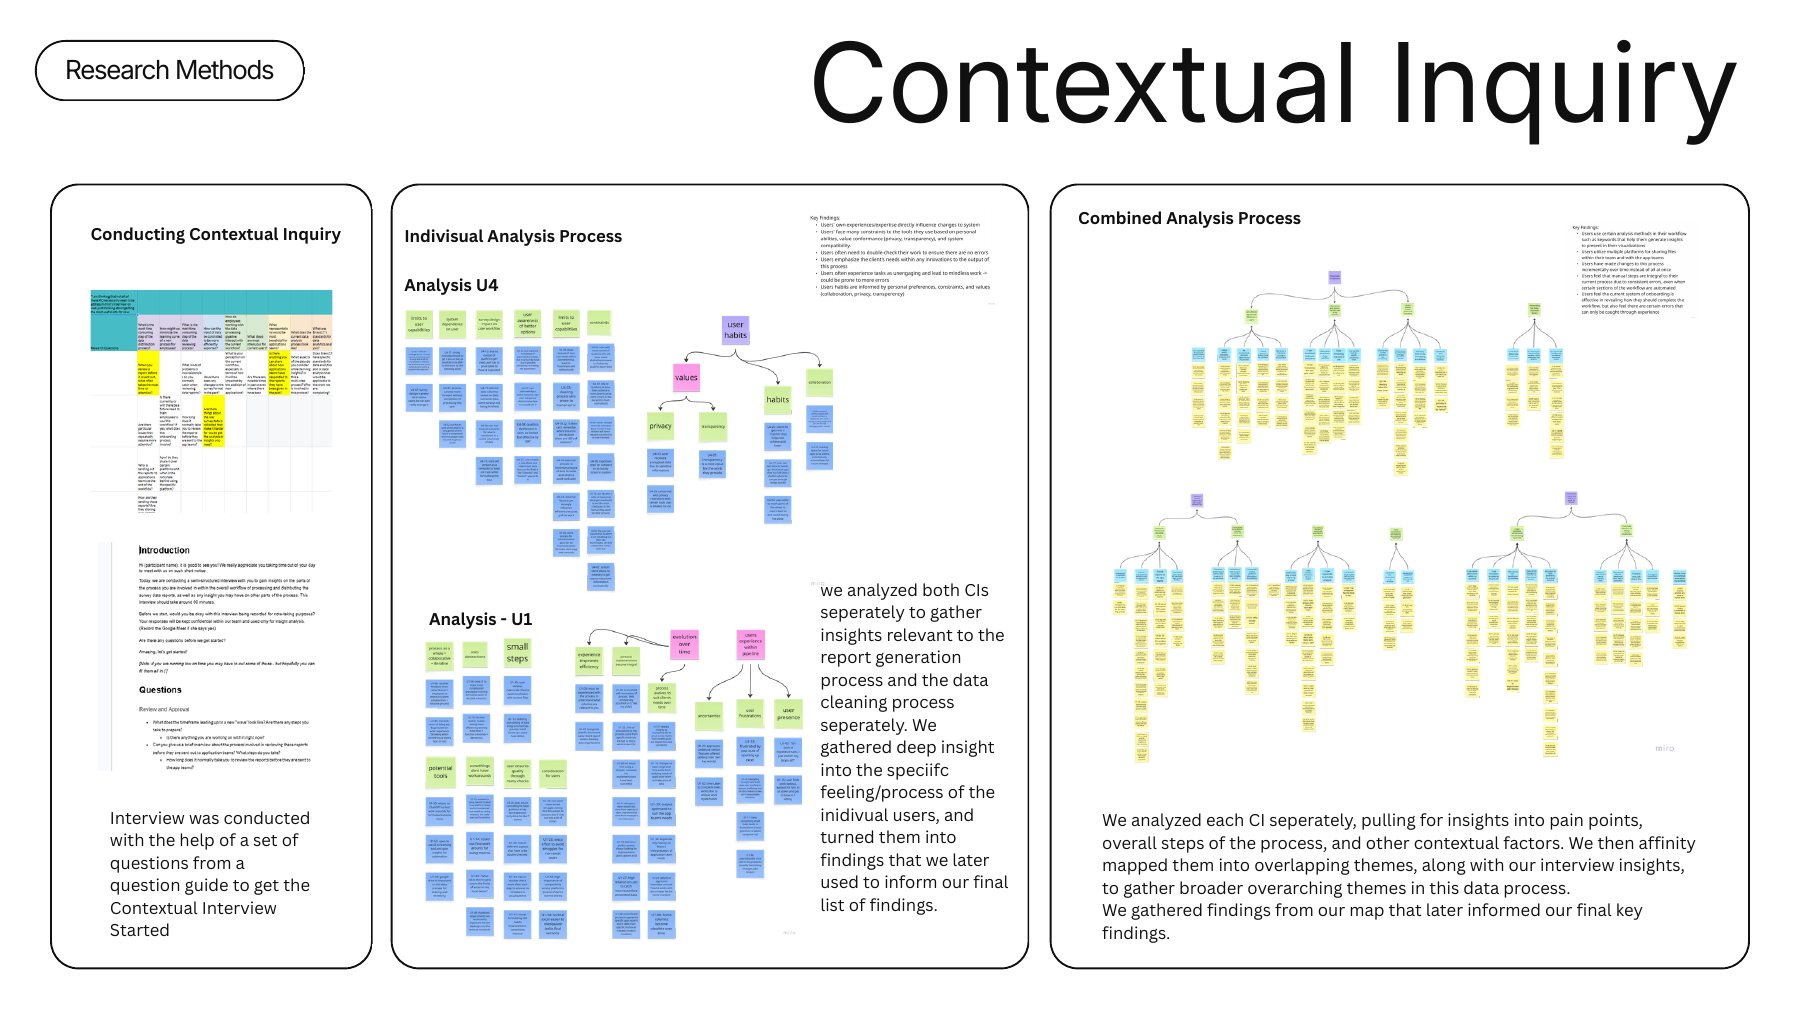
Contextual inquiry · 2 sessions, 50–60 min

Watching the real steps showed where the time goes.

We sat with the longest-serving member of the pipeline and with the person who exports and cleans the data, and had them walk us through their part step by step while we asked why.

My part: wrote the question guide, took notes for U1, co-interviewed U4, and joined both interpretation sessions.

Contextual inquiry: the question guide, individual affinity analyses for U4 and U1, and a combined analysis map.

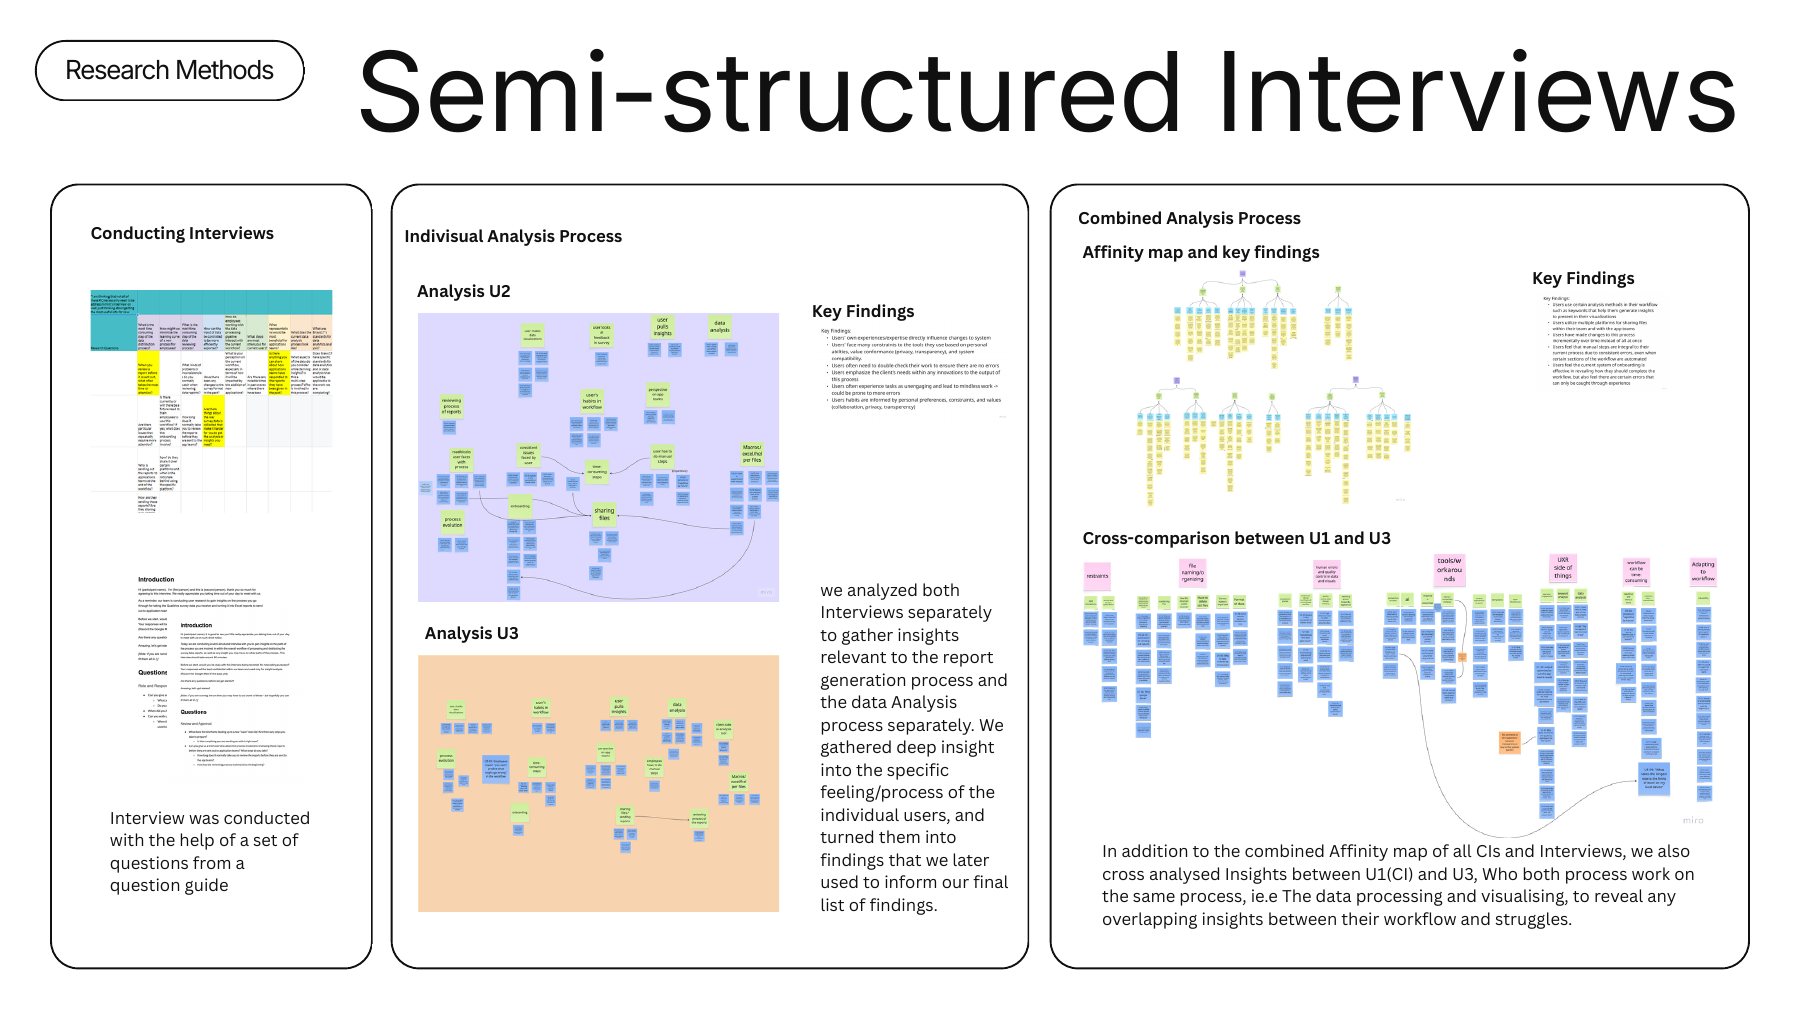
Interviews · 2 sessions, 60 min

Interviews explained why the process looks the way it does.

A newer team member and the reviewer who oversees the team told us about past fixes, workarounds, tools, communication channels and what application teams need. We then compared U1 and U3, who share the same processing step.

My part: wrote the interview guide, interviewed U3, and built the combined affinity map across interviews and inquiries.

Interviews: individual analyses for U2 and U3, a combined affinity map, and a cross-comparison of U1 and U3.

Expert interview and survey

The wider industry has the same problem.

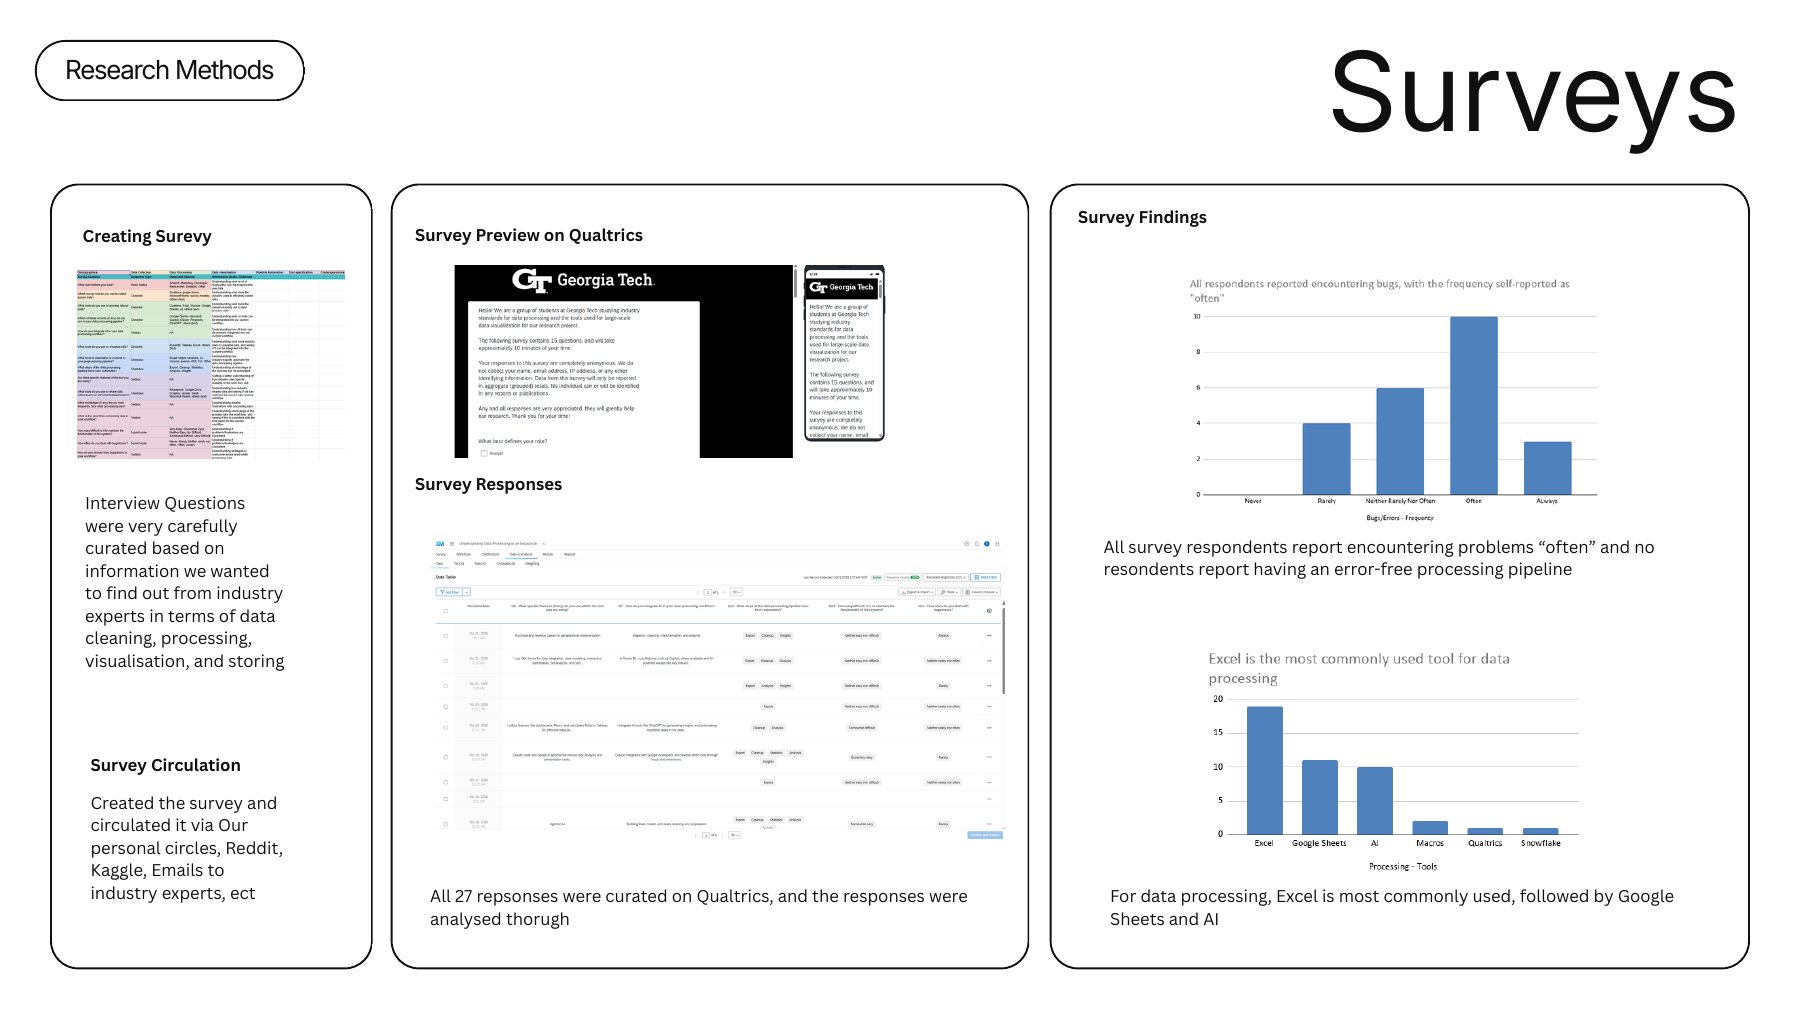
A vice president in data engineering walked us through industry tools and practices for storing, processing, visualising and transferring data. As they put it, your dashboards are only as good as your understanding of the data. Our survey (27 responses, 23 complete) found that every respondent runs into problems often, none has an error-free pipeline, and Excel is still the most common processing tool.

My part: sole interviewer for the expert, coded the transcript to shortlist tools, co-wrote the survey and recruited respondents.

Survey: the Qualtrics survey, responses, and charts showing all respondents report problems often and Excel is the most used tool.

Comparative analysis · I led this

I rated 40 tools against Bravo17’s real constraints.

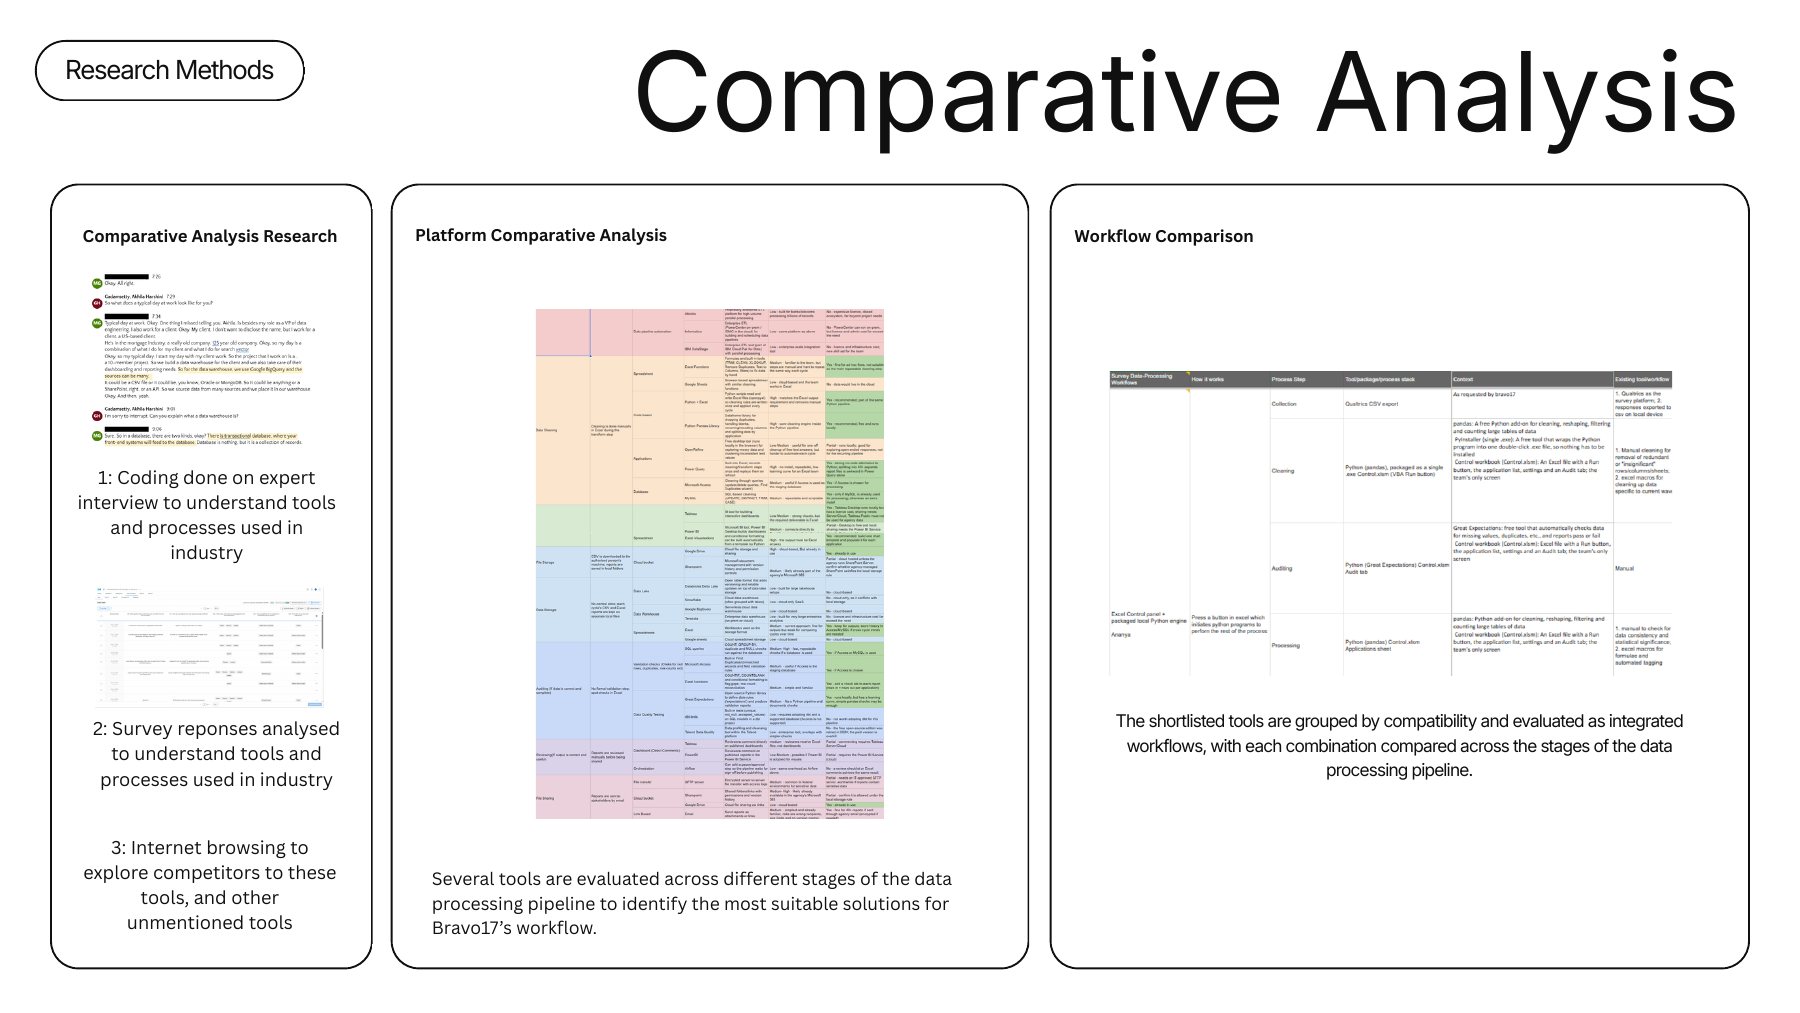
Each tool was judged on fit for the task (one CSV every two months, turned into 100+ reports) and fit with Bravo17’s limits: local data storage, privacy, Excel as the final output, IT approval, licence cost and learning curve. I then grouped compatible tools into three end-to-end workflows to compare with today’s process.

We also studied four companies that solved similar problems, including an Excel dashboard that saved one team more than 4,000 hours a year and a reporting dashboard that replaced a full day of monthly manual work.

My part: led the analysis, built the tool comparison sheet, defined the three workflows and split the workflow research across the team.

Comparative analysis: research inputs, a platform comparison spreadsheet, and a workflow comparison across pipeline stages.

Findings

Automation helps, but people still carry the quality.

Automation still needs human supervision. Charts come out inconsistent and data “gets stuck”, so manual checks remain essential. As one employee put it, maintenance takes longer than the actual generation.
Manual effort and waiting slow everyone down. Loading times break focus: “very few of us can just sit and wait patiently at a screen.”

Tool access and security rules complicate the work. Files move across Slack, SharePoint, Google Drive and email under strict restrictions.

Stakeholder needs shape every report. The format exists because application teams weren’t using the Qualtrics dashboard.

Onboarding works, but some knowledge is only learned by doing.

Design implications

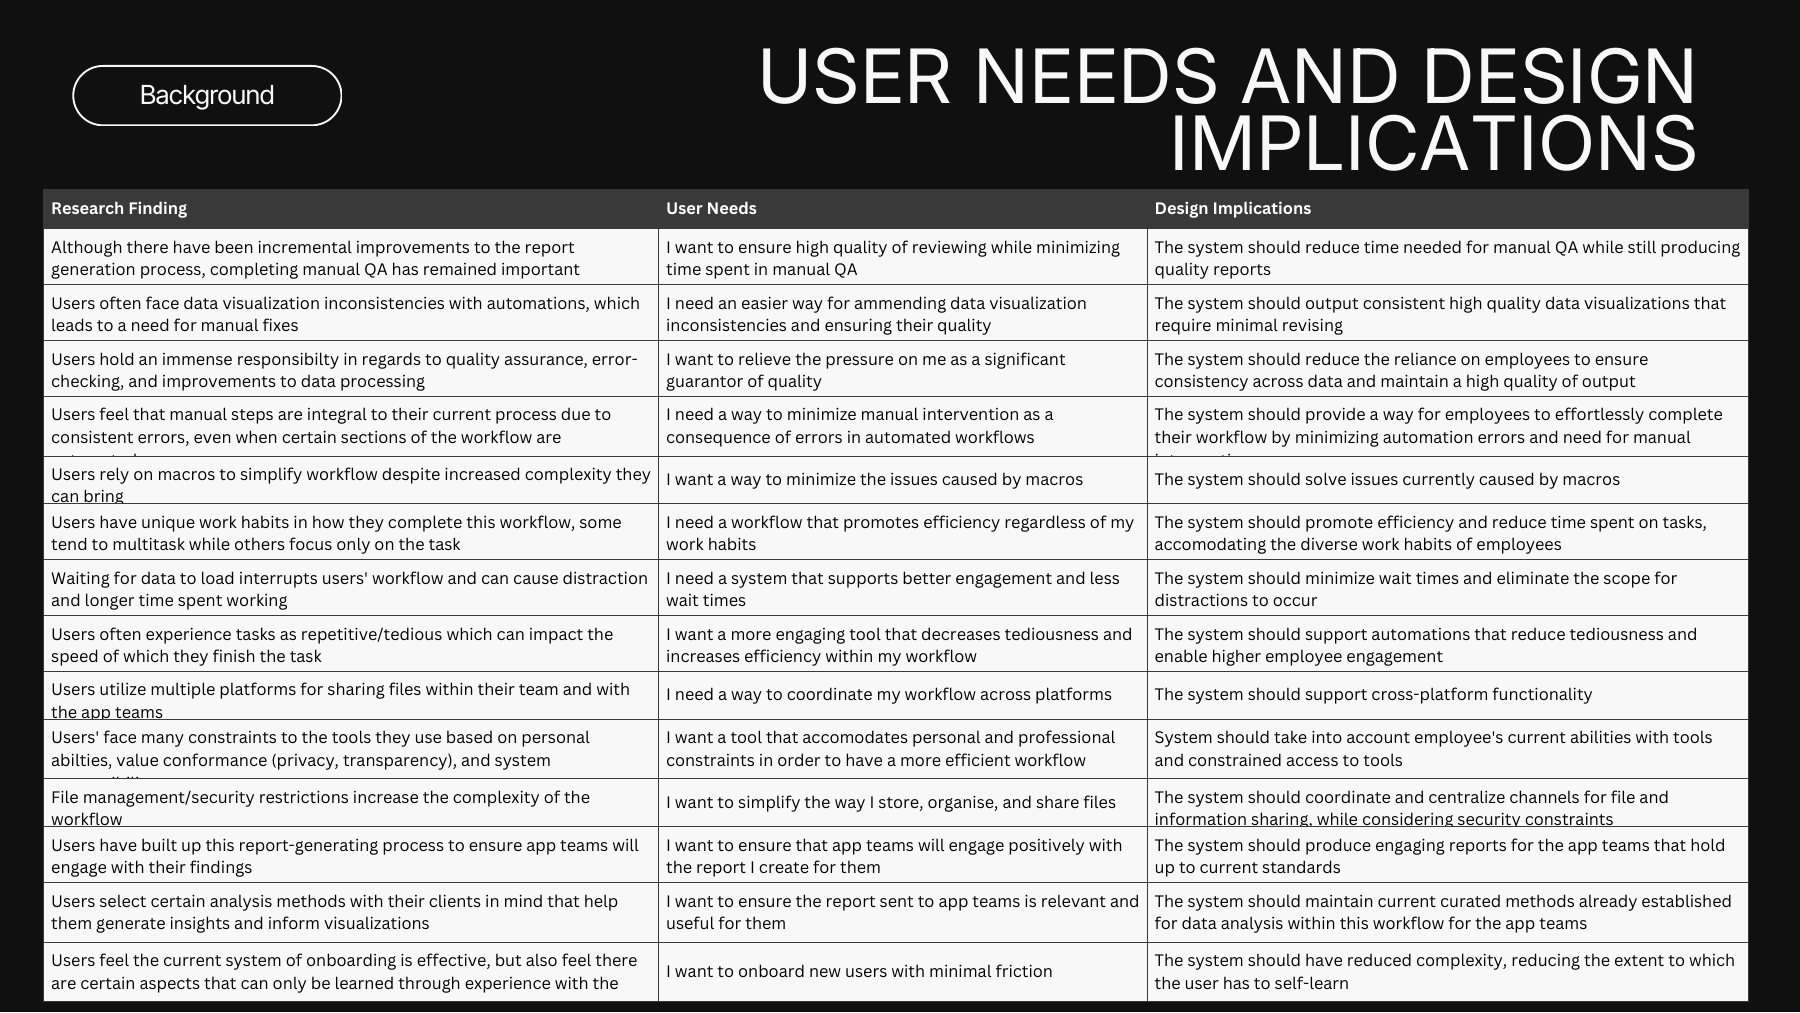
Every finding became a user need and a design implication, 14 in all.

We grouped them into four sets. The system should automate fixes (less manual checking, consistent charts, no macro problems); save time (fewer waits, less tedium, a short learning curve); respect tool and security constraints (work across platforms, centralise file sharing safely); and keep reports right for application teams (engaging, and true to the analysis methods they rely on).

Table mapping each research finding to a user need and a design implication.
Each finding traced to a user need and a design implication, with its sources.

Ideation and concept testing

We tested sketches with the two people who do the work before drawing a single screen.
While my teammates sketched concepts, I built a feature comparison chart from the comparative analysis to pinpoint features that suit Bravo17’s workflow. Together we chose the features, layout and flow.
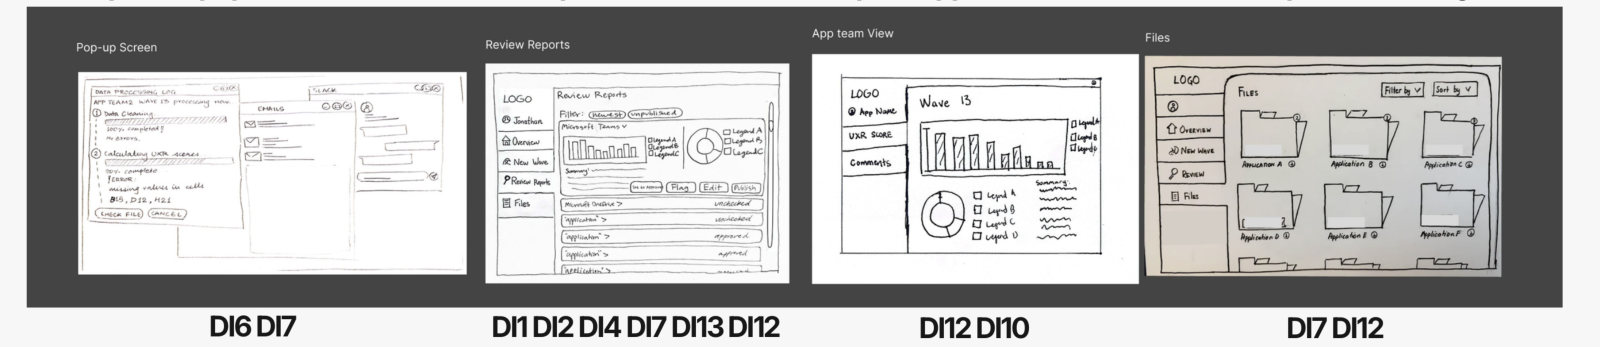
We tested the sketches with the employee who generates the reports, then revised them and tested again with the employee who reviews them. Concepts included a landing page, a step-by-step flow for a new survey wave, automatic error checks, a pop-up that tracks report generation in the background, a review page, an application-team dashboard and shared file storage.

My part: drew sketches for both sessions, helped write the session guides, and moderated and controlled the screen in both.

Session 1 concept sketches: home page, upload data, check data, check visualisations and a pop-up visualisation, each tagged with the design implications it addresses.
Session 2 concept sketches: the pop-up screen, review reports, the app team view and file storage.

What we changed: clearer wording for buttons and report generation; a stepper and consistent navigation in the new-wave flow; working with more than one wave at a time; more automated error checking for data and charts; full-screen report review; and keeping report-status messages for coworkers. The application-team dashboard raised privacy, security and onboarding concerns, so we kept an export to the current Excel reports.

Initial wireframes

Our first wireframes are initial concepts. Final prototypes are being made now.

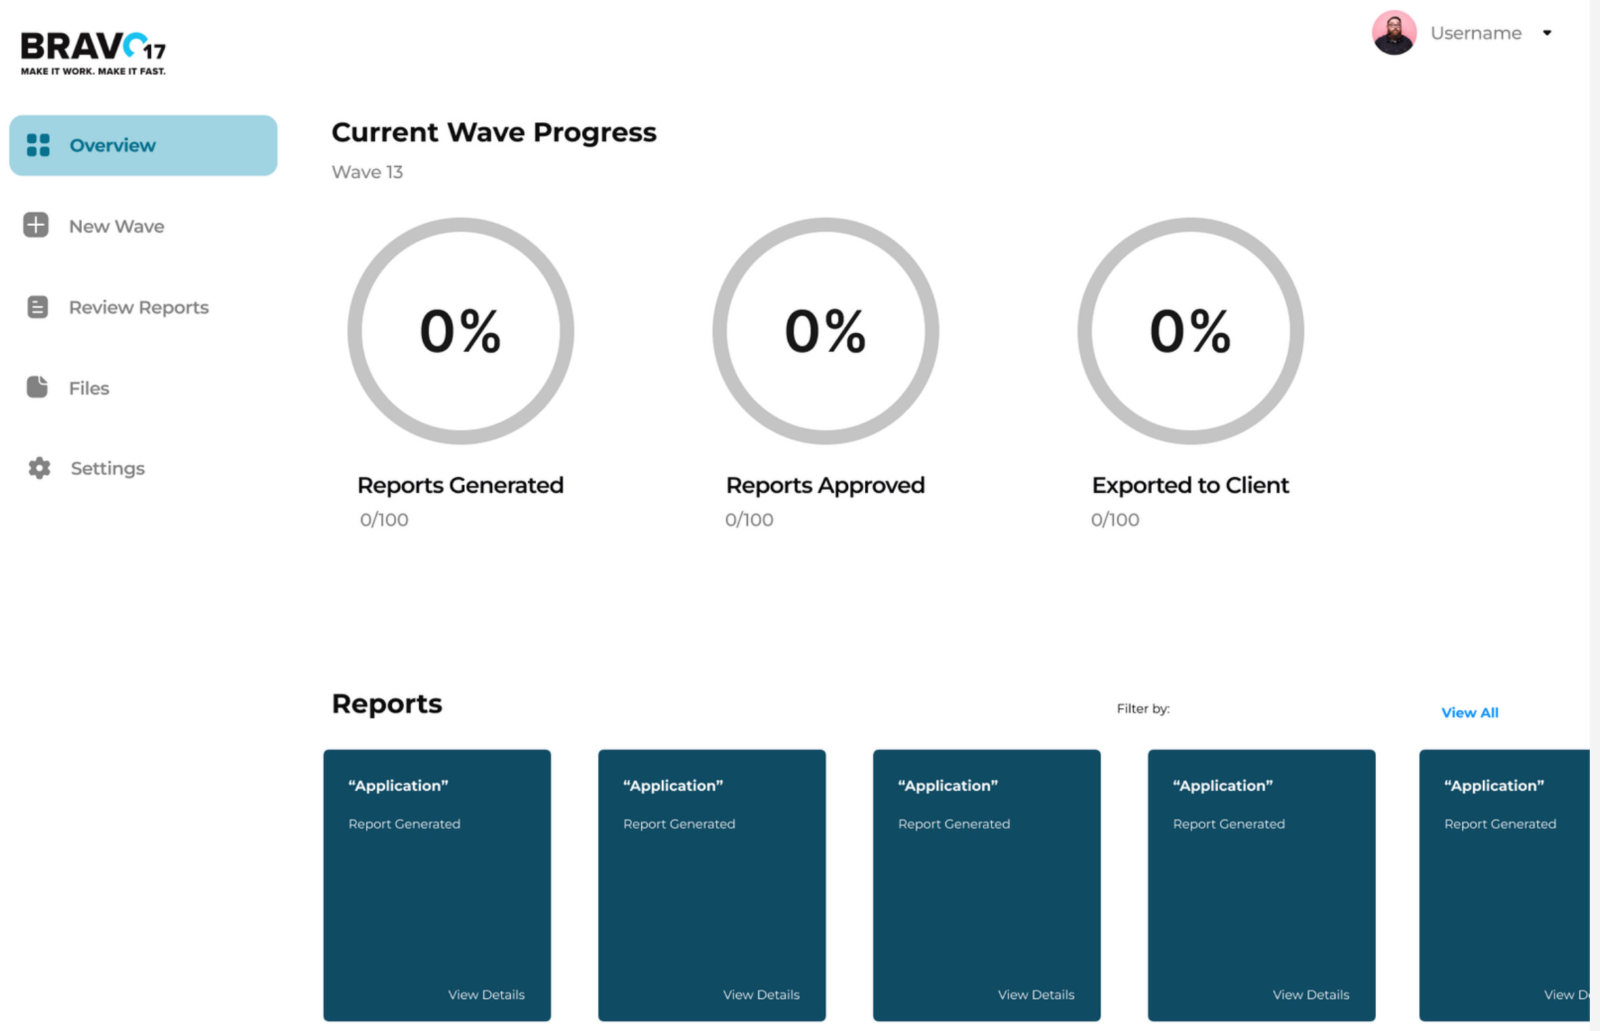
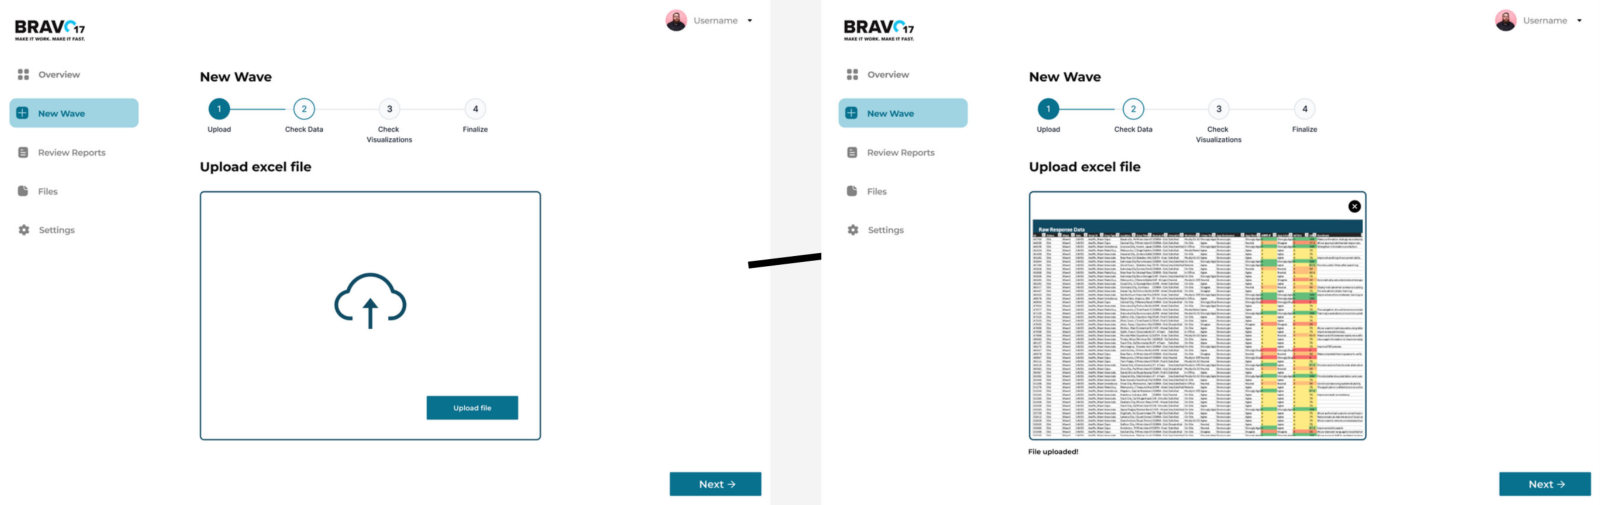
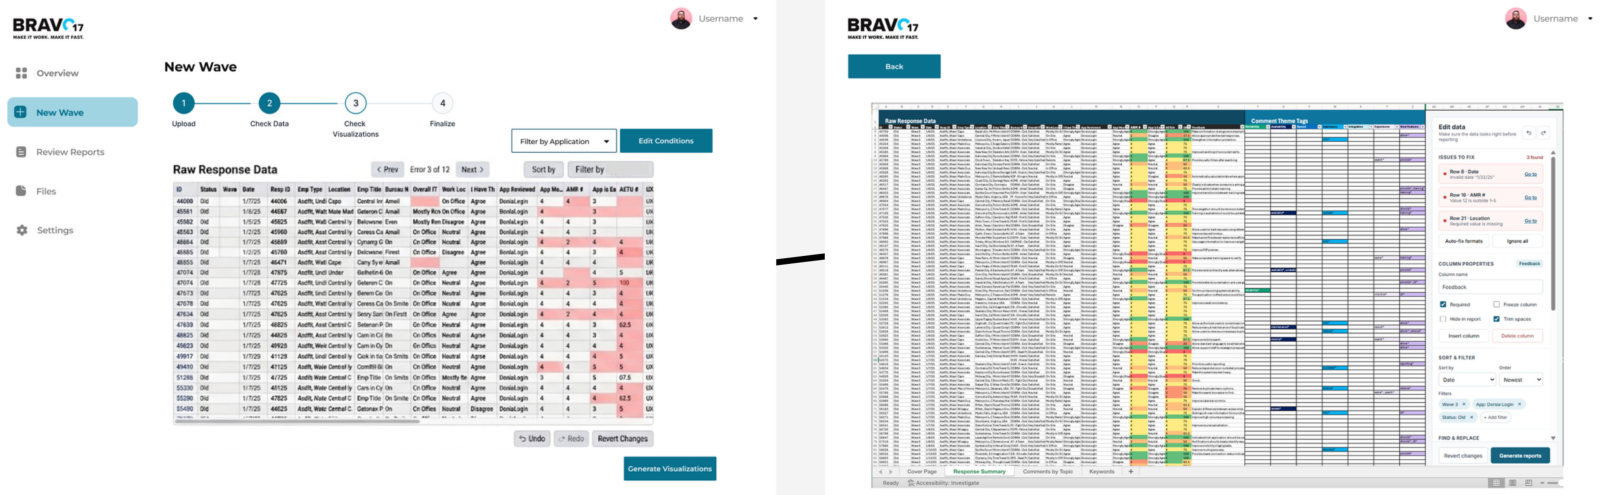
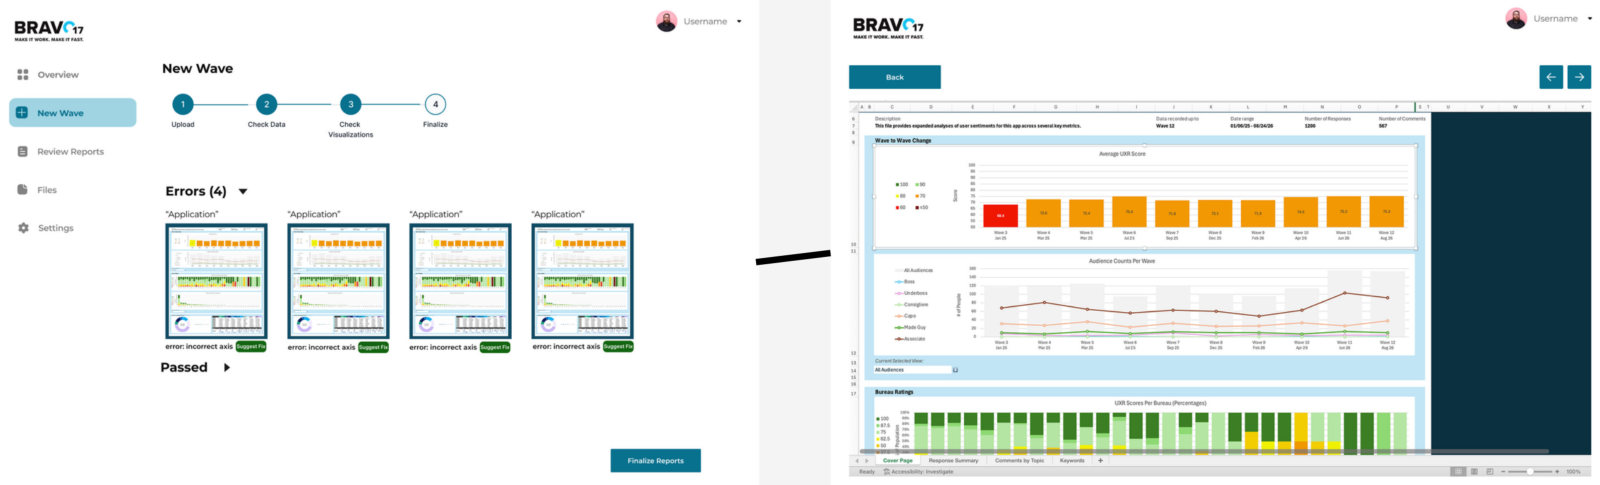
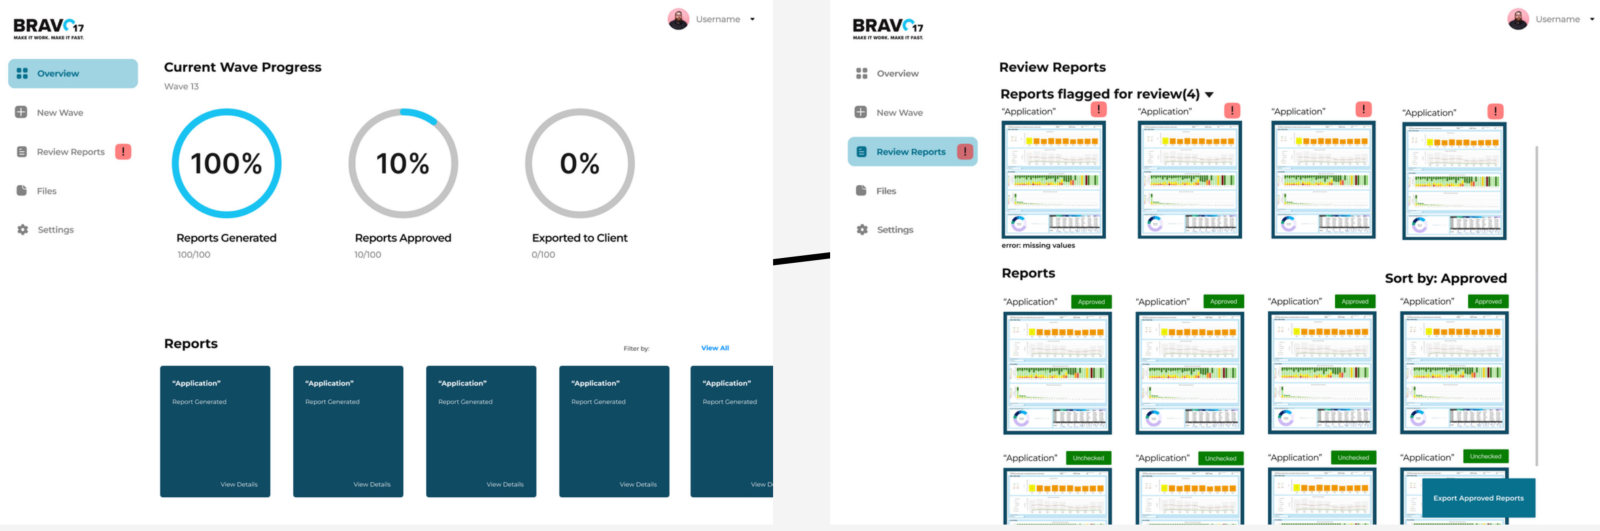
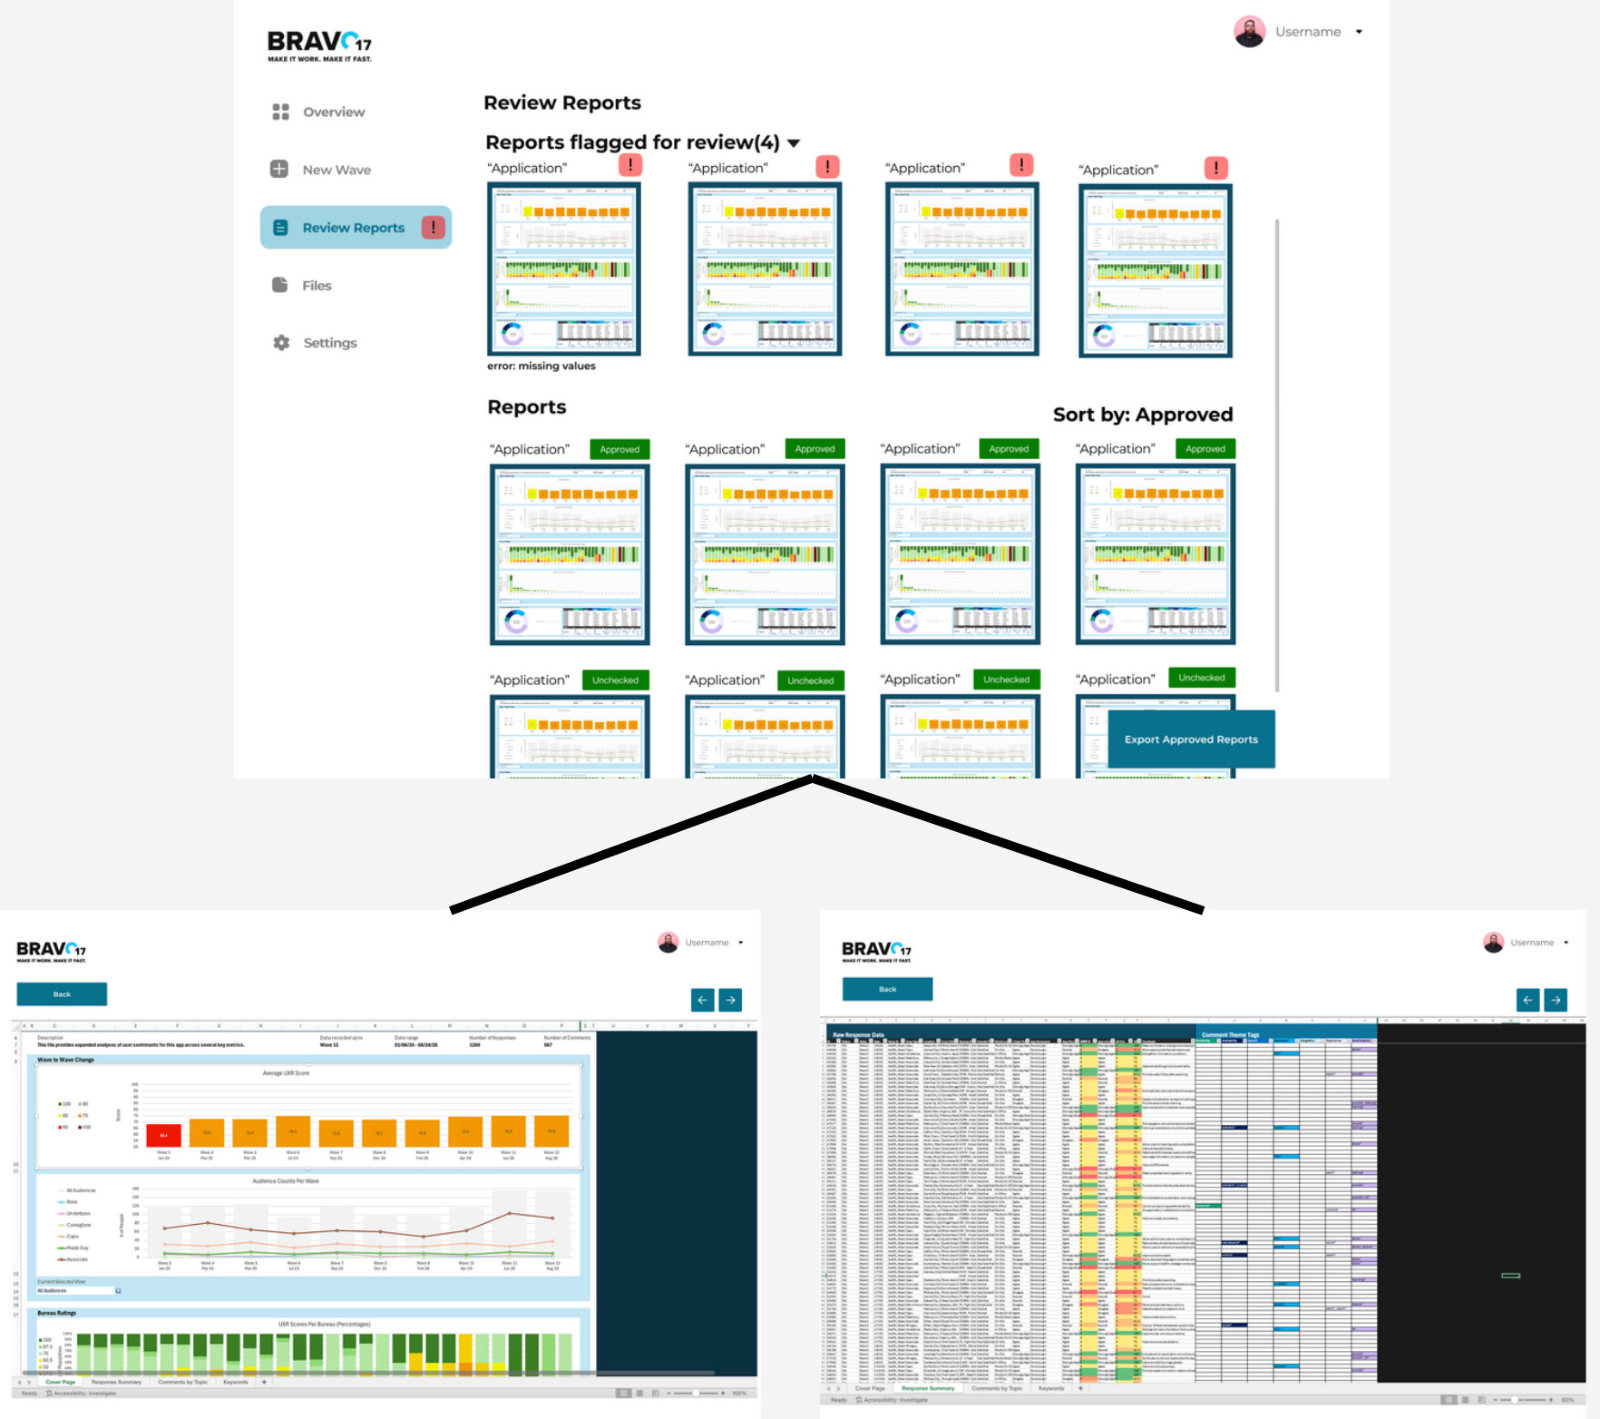
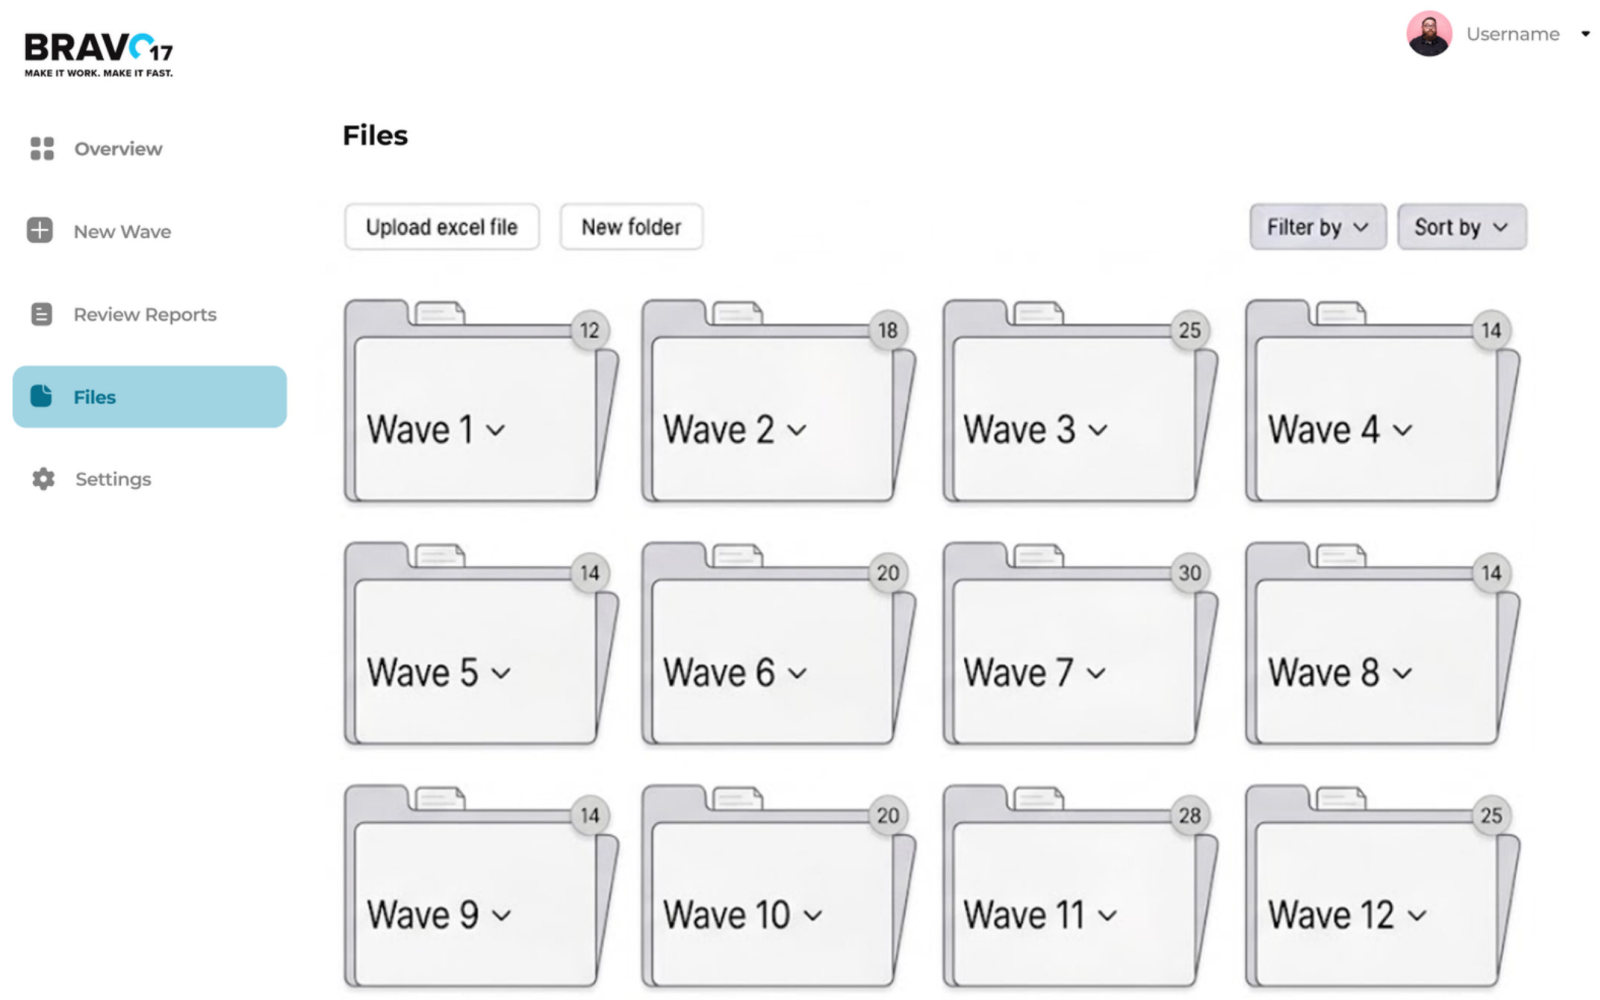
These screens show the core flow: an overview of the current wave, uploading and checking data with errors flagged automatically, checking charts, reviewing and approving reports, and files. They centralise storing, checking and correcting data in one place.

My part: interviewer in the wireframe session with the employee who generates the reports.

Initial wireframe: overview of the current wave with progress rings for reports generated, approved and exported to the client, and a row of report cards.

Overview of the current survey wave.

New wave flow: upload an Excel file, then preview the uploaded data.

1. Start a new wave by uploading the survey export.

Check data: raw response data with flagged rows, and an expanded spreadsheet view.

2. Check the data, with problem rows flagged.

Check visualisations: reports with errors listed, and an expanded report showing charts.

3. Check the charts, with reports that have errors listed first.

After generation: progress updates and the Review Reports page with reports flagged for review and approved reports.

4. Track progress, then review flagged and approved reports.

Review reports: flagged reports above approved ones, opening into the report and its data.
Files: survey waves stored as folders, with upload and new folder buttons.

5. Open a report to check it in full; files stored by wave. All initial concepts.

What the session showed: the user liked the simple landing page and progress tracking, and wanted clearer calls to action like “Get started” and “Generate reports”. They wanted errors called out clearly and fixed by clicking the cell, without opening a new tab; to feel confident the data is clean without reading all of it; to choose how many reports to generate at once; and clearer navigation. Report thumbnails were too small to be useful, and file storage didn’t seem better than their own device.

They also pointed out small text and a low-contrast grey. We’re carrying all of this into the final prototypes.

Accessibility

We’re designing to WCAG 2 from the first wireframe.

On our project panel’s advice we use a logical heading hierarchy, colour-blind-safe palettes, contrast checked with HCT tonal values, and a logical tab order. Our Bravo17 mentor suggested steppers and screen-reader-friendly tabs. Next we’ll raise small text sizes, fix the grey contrast and add more screen-reader support.

What’s next

Final prototypes, then usability testing with the team.

We’re turning the wireframe feedback into high-fidelity prototypes now, and will test each version with the employees who run the pipeline. We also want to test a basic working back end, so feedback is about real functionality rather than imagined behaviour.

Reflections so far

What workedContextual inquiries made our interview questions sharper, and everyone took part in every method, so the whole team understood the data.

ChallengesA very small user group, Bravo17’s many restrictions and tight timelines meant few sessions, and without a working back end our feedback was based on imagined functionality.

Next timeWrap up interpretation sooner, widen survey outreach, interview experts from more data-heavy fields, and test with a basic implementation.

Learning a grandparent’s language from your own photos

Course projectMobile appFall 2026

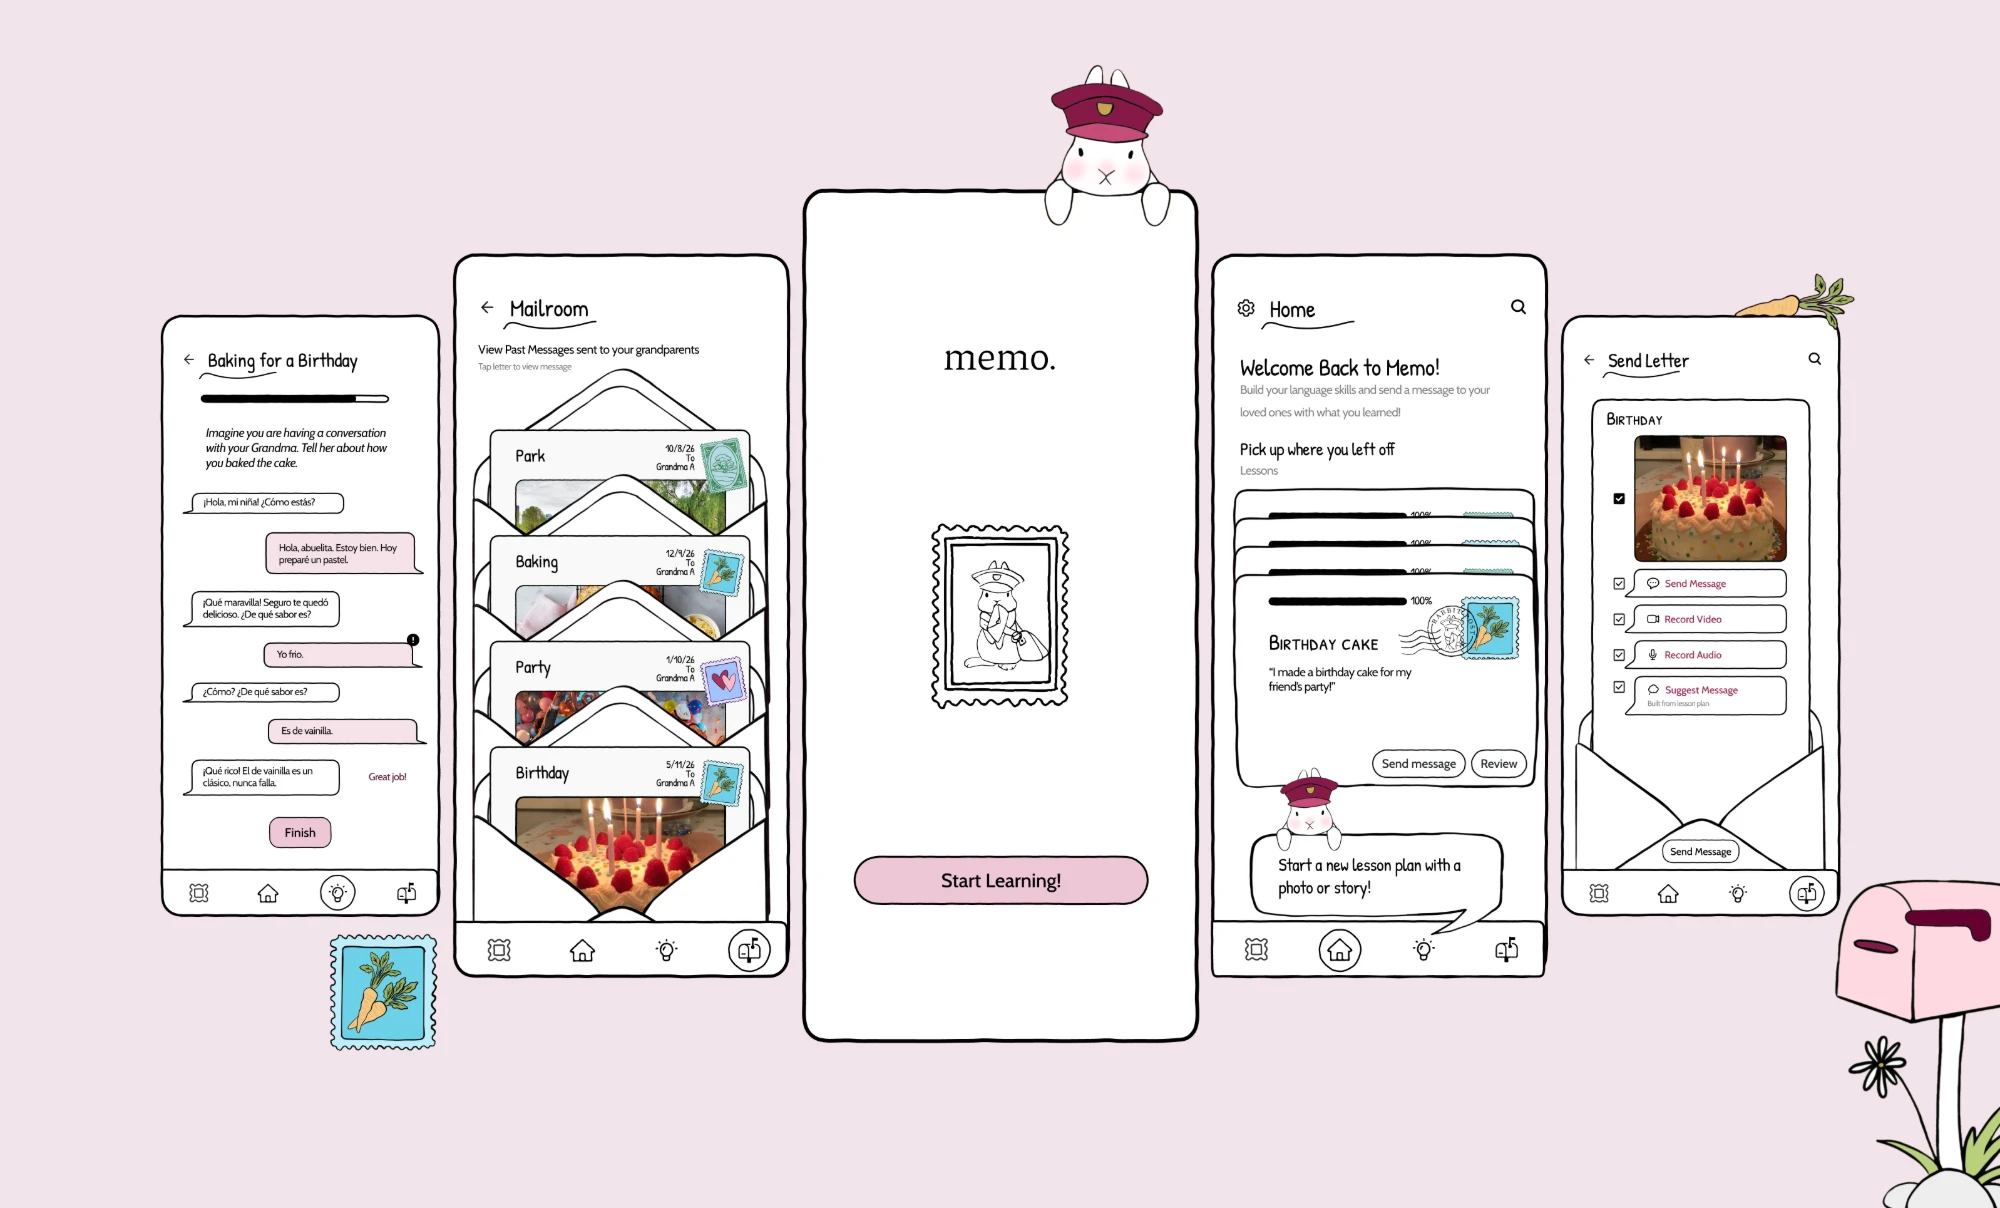
memo. cover: five screens on a pink background (the practice chat with Grandma, the Mailroom, the memo. splash with the rabbit mail carrier peeking over the top, Home, and Send Letter), with a carrot stamp, a carrot and a pink mailbox drawn around them.

Product memo.

memo. is a language-learning app for grandchildren who don’t share a language with their grandparents. Its end goal is a closer relationship with them. Lessons are built from your own photos, and each one finishes with a letter to your grandparent about what you learned.

Details

Mobile app · clickable Figma prototype
surface
Co-researcher · design language lead · interaction and visual design
my role
Echo O’Connor, Ananya Bhide, Mikaela Castillo
team members
Research ∙ Ideation ∙ Design language ∙ Components ∙ Hi-fi screens ∙ Illustration ∙ Prototyping ∙ Paper testing
my scope
CS 6755 HCI Foundations, Georgia Tech
course

Problem Not enough shared language

Grandchildren and grandparents want to stay close, but limited fluency, dialects and slang keep their conversations short. Many families rely on gestures, emojis or a relative who translates.

Solution Lessons from your own life

Personalised Spanish lessons built from the grandchild’s photos and aimed at talking with one grandparent. When a lesson is done, the grandchild sends a letter through WhatsApp or Messages.

Result A tested prototype

Two rounds of paper testing and a clickable high-fidelity prototype, with an evaluation plan ready to run. We have not tested it with families yet.

99survey responses on how families stay in touch
12interviews with grandchildren and grandparents

Context

Many families now live in different countries, and grandchildren often speak little of their grandparents’ language.

Living apart removes the everyday contact grandparents and grandchildren used to have (Reis et al., 2021). For families who have moved countries, the heritage language is a second barrier, and it is closely tied to how close family members feel (Bose et al., 2026).

Research

Grandchildren do call their grandparents, but they don’t know enough of the language to say much.

I was one of the team’s researchers. We observed a WhatsApp video call between a grandmother (75) and her partly fluent granddaughter (19). The granddaughter gestured, showed things on camera and stopped to look up a word in Google Translate. The grandmother led every topic.

We then ran interviews and a survey, and grouped what we heard in an affinity map. Families use workarounds that help in the moment but don’t build language skills. Grandparents usually start the conversation while grandchildren listen. Some grandchildren call because they feel they should. And photos were the most common way families shared their lives.

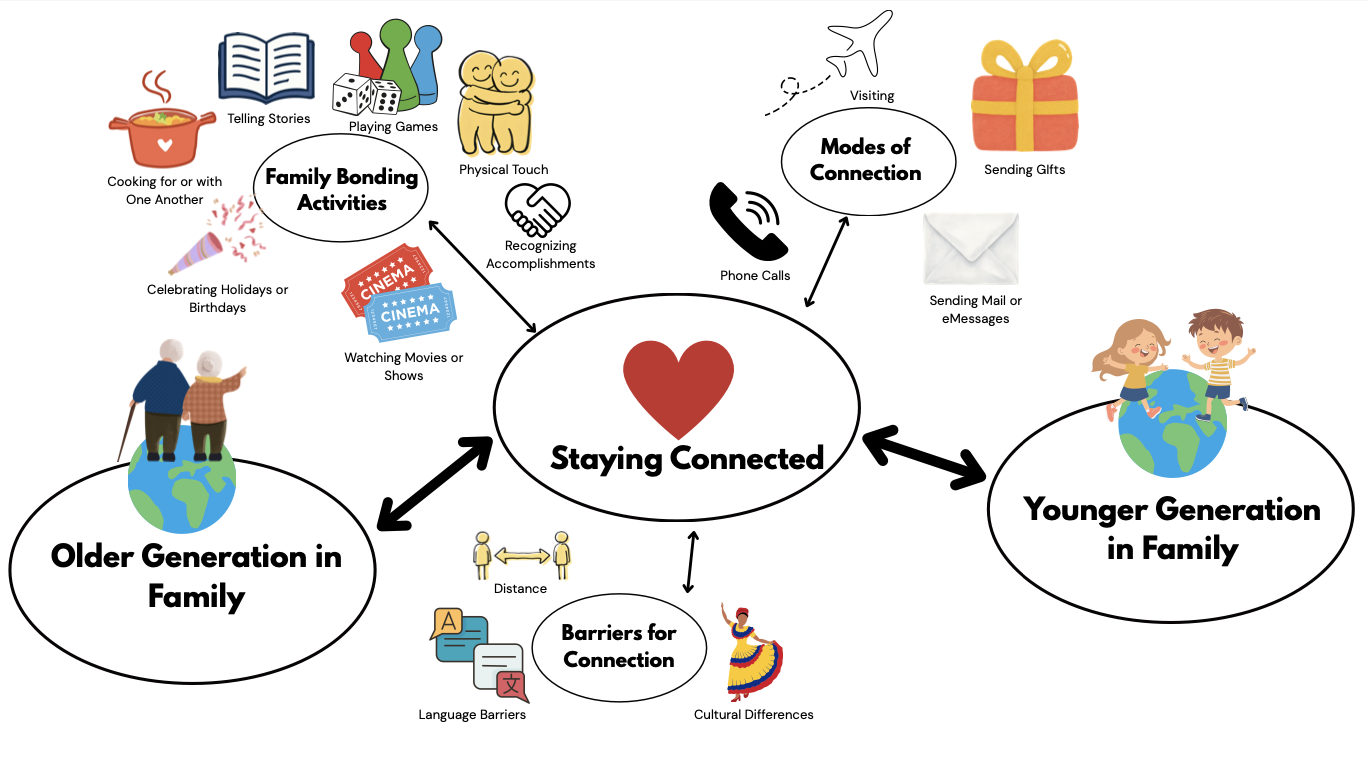
System diagram of how intergenerational family members stay connected: older and younger generations linked through modes of connection and family activities, with barriers like language, distance and culture.

How grandparents and grandchildren stay connected, and what gets in the way. From our first research report.

The question

How might we help bridge the emotional gap that language and distance create between grandchildren and their grandparents?

Ideation

I sketched ten concepts, and the team compared them before choosing one.

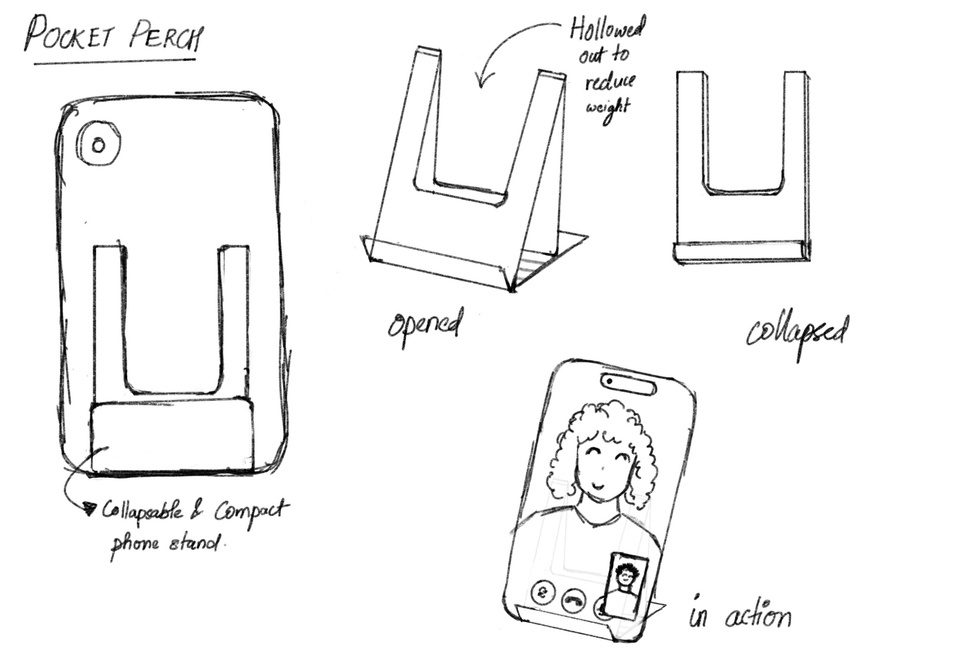
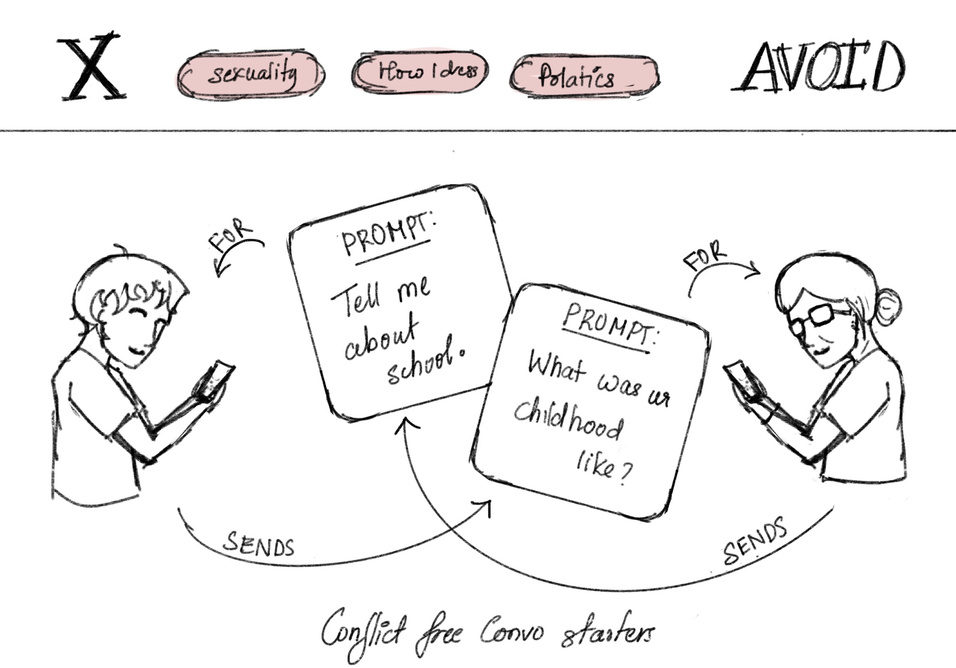
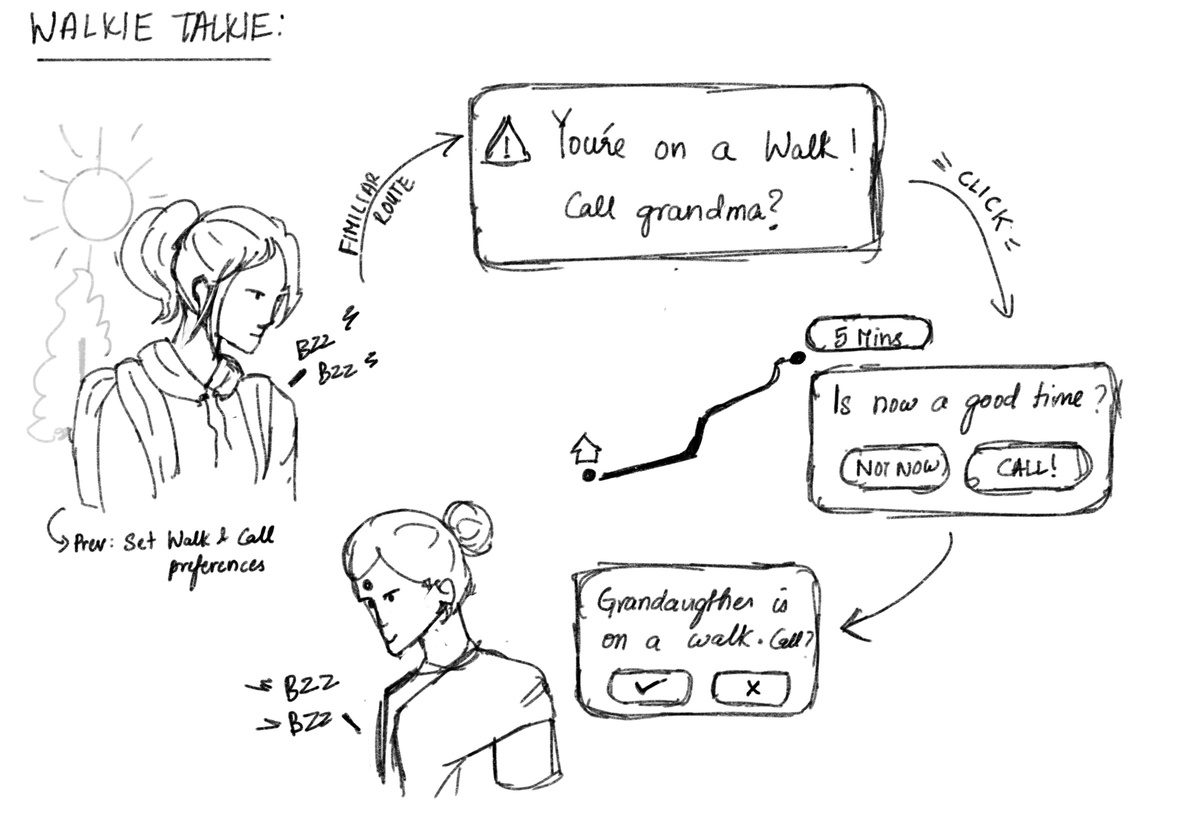
Each concept responded to a research finding, for example a phone stand for hands-free video calls, a shared family phrasebook, and conversation cards for awkward calls. I used comparative analysis, rapid sketching, SCAMPER and paper prototyping, and storyboarded my two strongest ideas.

Sketches of Pocket Perch, a collapsible phone stand shown open, collapsed and in use on a vertical video call.
Sketch of The Floor Is Yours: topics to avoid are crossed out, and two people trade prompt cards like ‘Tell me about school’.
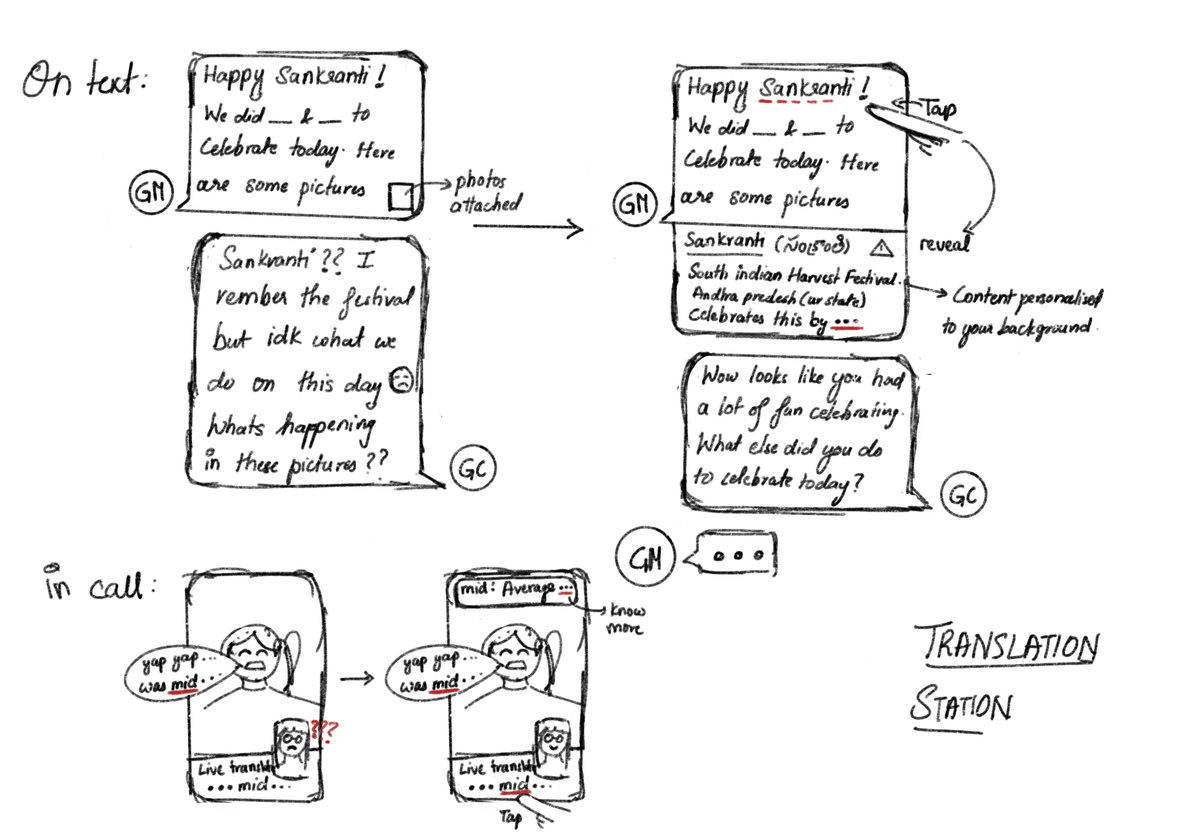
Sketch of Translation Station: a family library of phrases with optional explanations during messages and calls.
Sketch of Walkie Talkie: a grandchild on a walk is asked whether to call grandma, and the call starts only when both say yes.

Four of my ten concepts: Pocket Perch, The Floor Is Yours, Translation Station and Walkie Talkie.

A change of direction

We first planned two-way communication inside the app, then changed direction.

Many of our early concepts had grandparents and grandchildren using the app together. In research, grandparents were clear that they didn’t want new technology. One 85-year-old used a feature phone, told us “old is gold”, and cared more about better conversations than new devices.

So we designed memo. for the grandchild only. Grandparents receive the grandchild’s messages in WhatsApp or Messages, which they already use, and can reply there.

The idea

memo. is a language-learning app with one end goal: a stronger connection with your grandparents.

Heritage-language learners often say they study so they can talk with family (Carreira & Kagan, 2011). Most language apps are built for studying alone with general content (Ciuba et al., 2026).

memo. teaches the words a grandchild needs to tell their grandparent about their own life. Each lesson comes from a photo of something that happened to you, and finishing it leads to sending your grandparent a message. We chose it because it was the only idea that didn’t ask grandparents to learn anything new.

Paper prototype

We drew the screens on paper and tested them with two people.

We made the screens and swappable buttons by hand and asked each tester to build a lesson. The first tester had trouble with the opening steps and then got through the rest. We relabelled the first screens, and the second tester completed every step.

The main lesson was that every button needed to say exactly what it does, which is where labels like “Start Learning!” and “Go to flashcards” came from.

My part: ideation, drawing screens and buttons, documenting the session, and observing the tests to decide what to change.

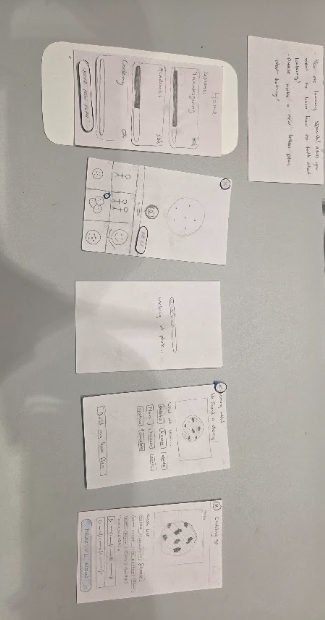
Hand-drawn paper screens laid out in order on a table.
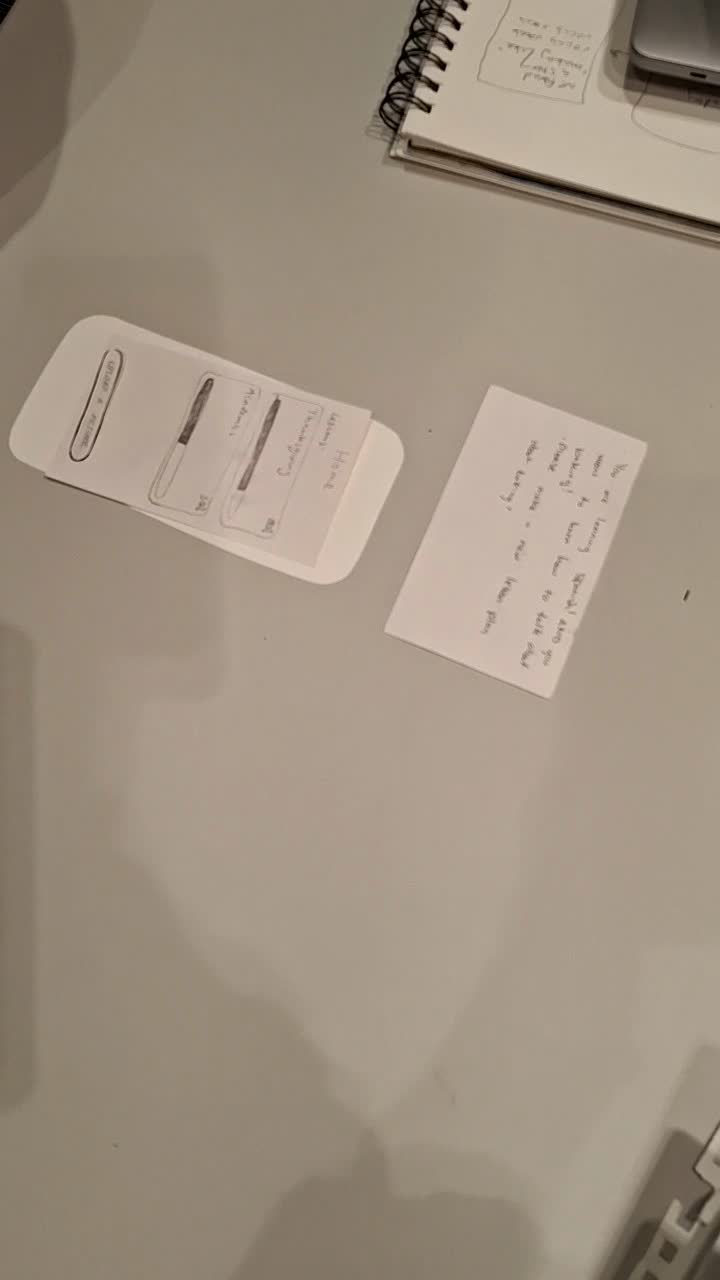
The first tester's hands moving through the paper prototype.
The second tester navigating the revised paper prototype.

Our paper screens, then test 1 and test 2.

Wireframes

Before Figma, we redrew every screen of the final flow on paper.

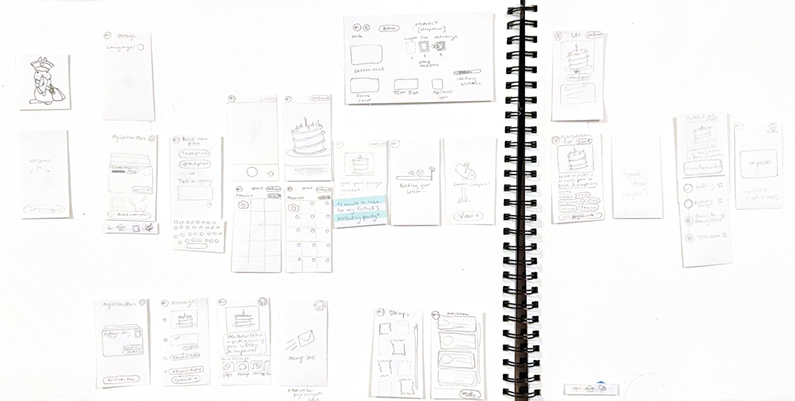
These wireframes set the layout for the high-fidelity screens: the home screen with lesson letters, building a lesson from a photo, the lesson and its chapters, sending a letter, the Mailroom and the stamp collection.

Paper wireframes laid out across a sketchbook spread: the splash screen, settings, building a lesson plan from a photo, the camera and photo album, the lesson with vocabulary, the chapters, sending a letter, stamps and the Mailroom.

Our paper wireframes for the final design.

Design system

I led a design system based on writing letters.

Our research showed that older relatives are comfortable with physical ways of keeping in touch, and many of our concepts already had a tactile side. So memo. borrows from a postal service: messages are letters, finished lessons earn stamps, past letters live in a Mailroom, and the mascot is a rabbit mail carrier. I set the rules below, built the components, and designed the screens with Echo.

Colour

We sampled the palette from our moodboard. We started with Deep Berry and dropped it because it didn’t fit the visual style we wanted. Raspberry marks actions, Rosa and Blush mark accents and selected states, and everything sits on white paper with black ink.

Raspberry#962753 · buttons, links Rosa#B5406B · accents Blushselected chips, primary buttons Paper#FFFFFF · background Ink#000000 · text, outlines Deep Berry#5D1232 · dropped

Type

Two typefaces keep a handwritten feel while staying readable. We first tried Playpen Sans, then chose Patrick Hand because it fits the letter-writing idea better. Cabin carries everything people need to read closely. No text is smaller than 16px.

Pick up where you left off

Patrick Hand · headings, navigation, lesson and letter titles

Le hice un pastel a mi amiga para su fiesta de cumpleaños.

Cabin · lessons, instructions, button labels

Shape and icons

One hand-drawn rounded rectangle is used for paper, postcards, notes, cards, buttons and input fields, so the whole app reads as one set. Milestones use perforated stamp edges. The menu icons are hand-drawn too, and the active tab is shown by circling its icon.

Components

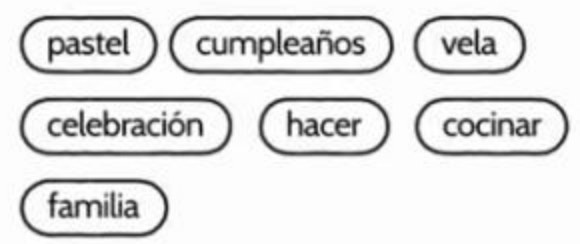
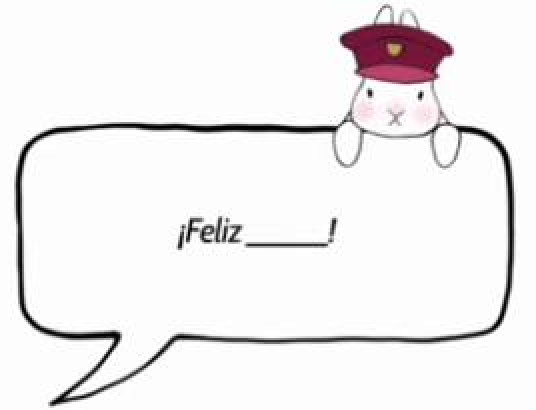
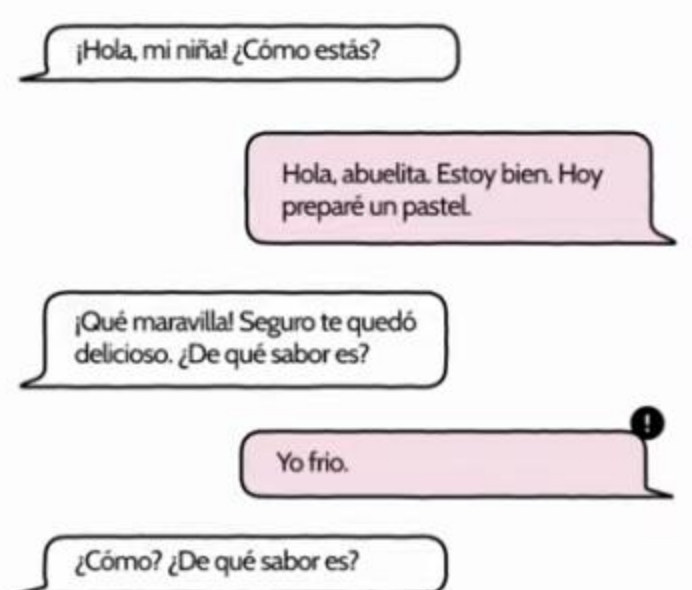
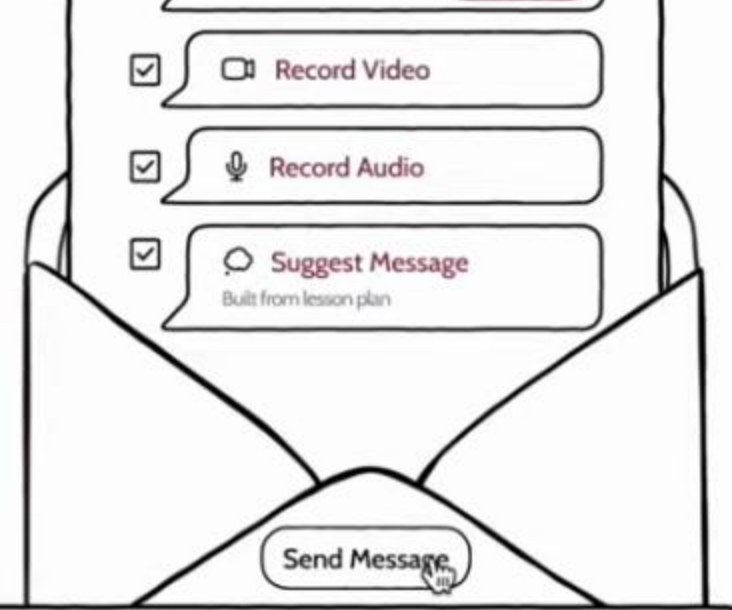
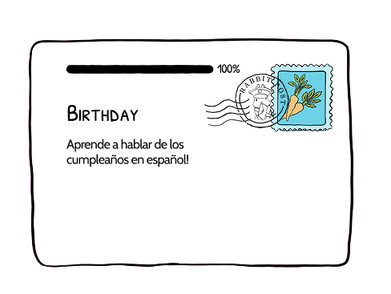
The core pieces repeat across every screen. Lessons are letters with a progress bar and a stamp. Vocabulary uses outlined chips that fill with Blush when chosen. The rabbit peeks over speech bubbles in exercises. Practice chats use outlined bubbles for Grandma and Blush bubbles for you. Sending happens inside an envelope.

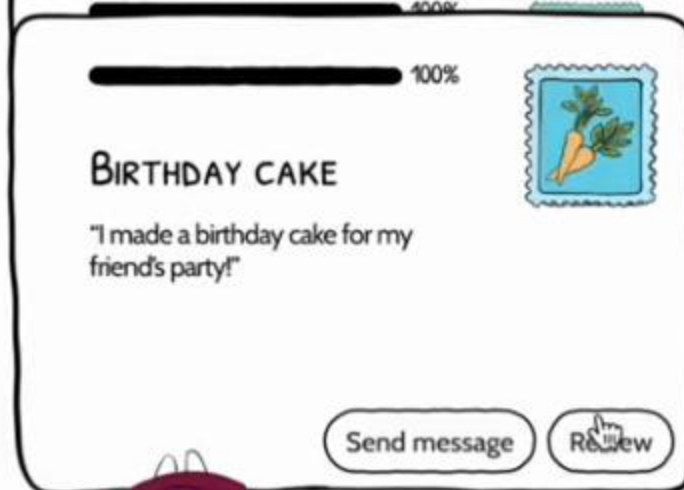
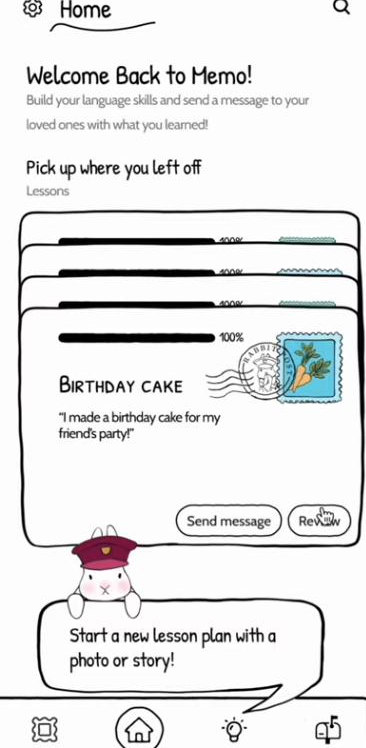
Lesson letter card: progress bar at 100%, title Birthday cake, a quote, a carrot stamp, and Send message and Review buttons.
Lesson letter
Vocabulary chips: pastel, cumpleaños, vela, celebración, hacer, cocinar, familia.
Vocabulary chips
Speech bubble reading ¡Feliz ___! with the rabbit peeking over it.
Exercise bubble
Chat bubbles between Grandma and the grandchild in Spanish.
Practice chat
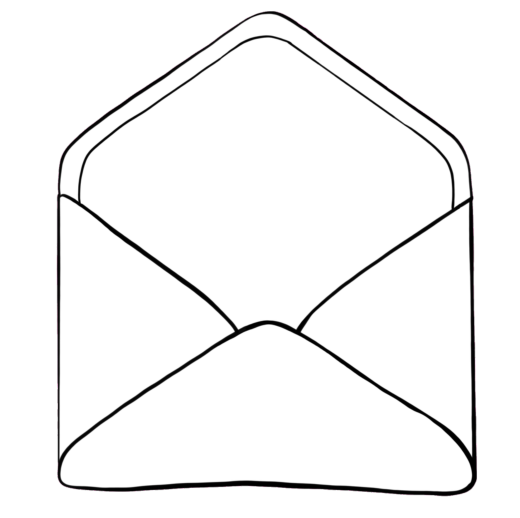
Send options and a Send Message button inside an envelope.
Envelope
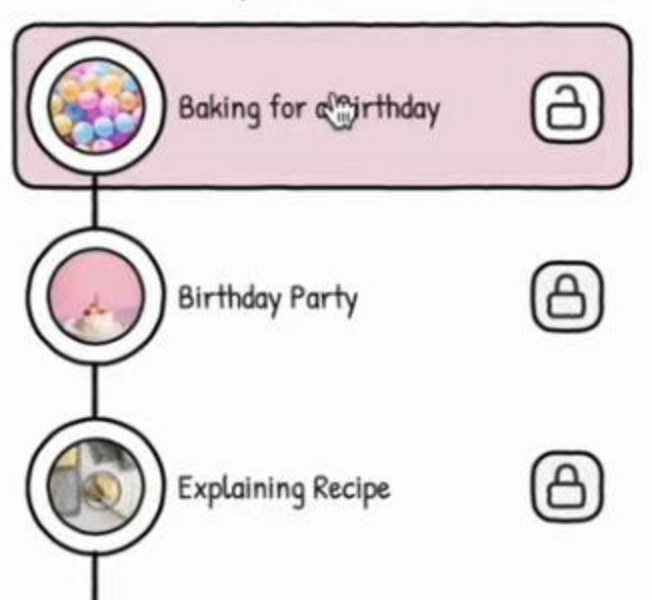
Lesson chapters as a vertical path with round photos and lock icons.
Chapter path

Illustration

Echo and I drew the illustrations. We matched their line weight and stroke in every digital asset, and even redrew the camera screen in the same style, so drawings and interface feel like one thing.

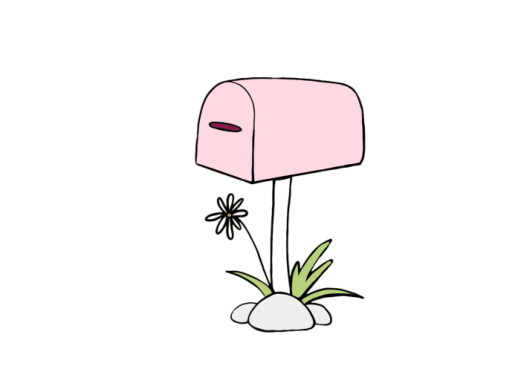
Rabbit mail carrier in a raspberry cap holding a letter. Stamp with carrots on a blue ground. Green engraved stamp with a tree. Lesson card drawn as a letter with a stamp. Hand-drawn open envelope. Pink mailbox on a post with a flower.

From research to design

We turned each research finding into a feature.

These are the requirements we carried from research into the final design, each shown with screens from our Figma prototype.

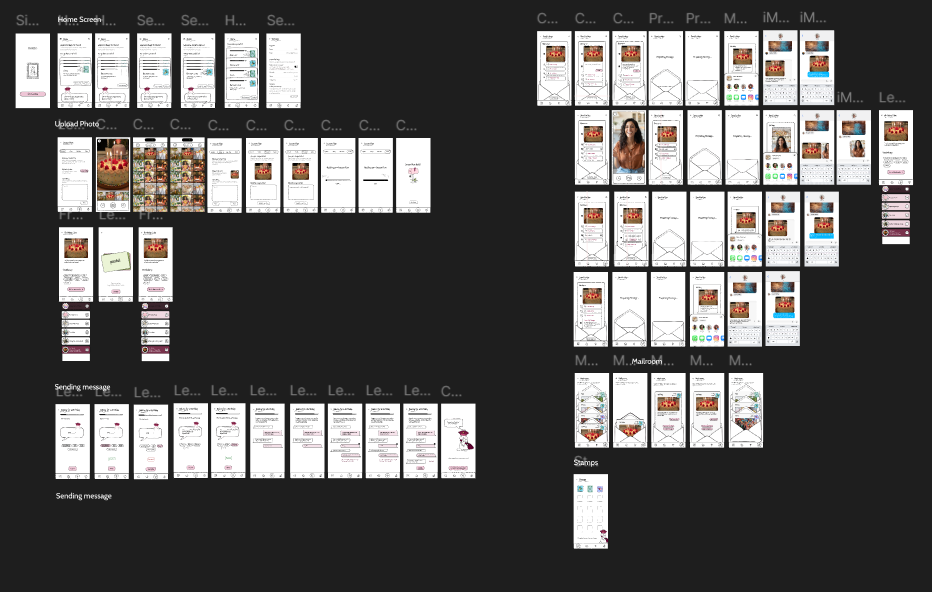
Our Figma file with every screen of the prototype grouped into flows: Home Screen, Upload Photo, the lesson, Sending message, the Mailroom and Stamps.

Every screen in our Figma prototype, grouped by flow: home, uploading a photo, the lesson, sending a message, the Mailroom and stamps.

Shared context

Families shared photos to keep up with each other’s lives, even without a common language.

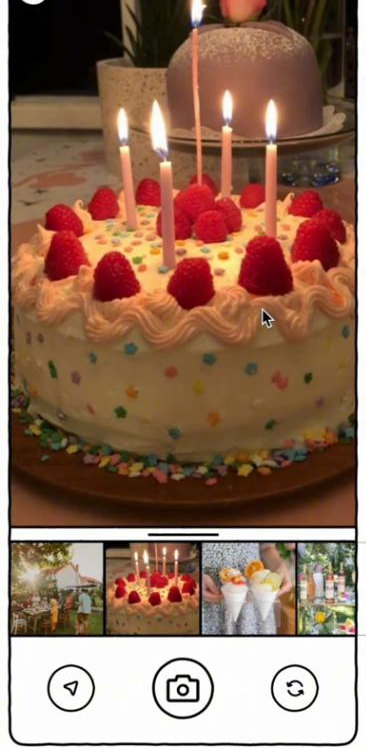
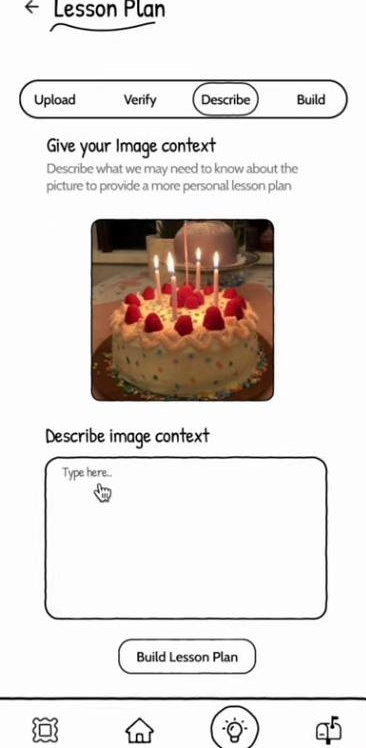
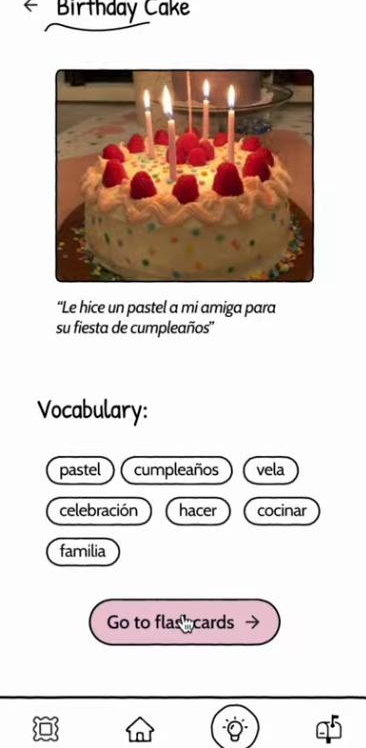
Every lesson starts from a photo or a short story. You describe what happened and who it’s for, and memo. builds the lesson around it.

Upload screen with a birthday cake photo selected from the camera roll.
Upload a photo
Lesson plan builder, Describe step: give your image context in a text box, then Build Lesson Plan.
Describe the moment
Birthday Cake lesson: the photo, a Spanish sentence about it and vocabulary chips.
Learn its words

Language learning with a specific goal

Translation tools helped during calls, but grandchildren weren’t learning the language.

Each lesson plan builds toward one conversation. You learn the vocabulary, fill in blanks, and then practise a chat with Grandma, with hints when you get stuck.

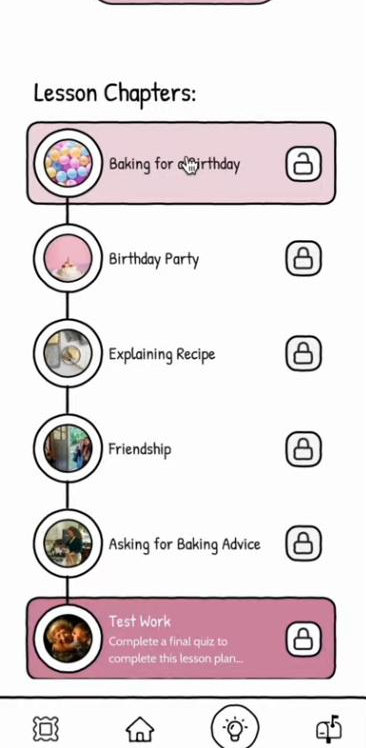
Lesson chapters from Baking for a Birthday to Asking for Baking Advice, ending in a final quiz.
Chapters toward a goal
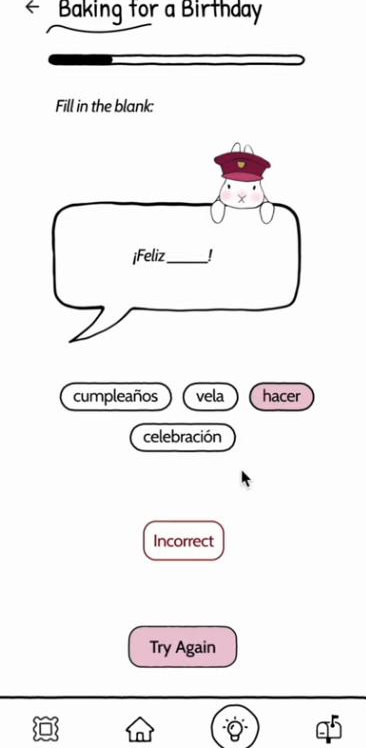
Fill in the blank: ¡Feliz ___! with word choices and an Incorrect, Try Again state.
Practise the words
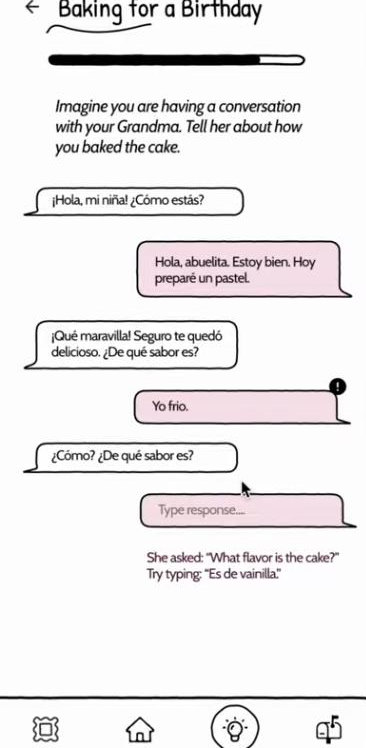
Practice chat with Grandma in Spanish; a wrong reply is flagged and a hint suggests ‘Es de vainilla’.
Rehearse with Grandma

No new technology for grandparents

Grandparents didn’t want to learn a new app.

memo. is only for the grandchild. A finished lesson becomes a letter that opens in WhatsApp or Messages, which grandparents already use.

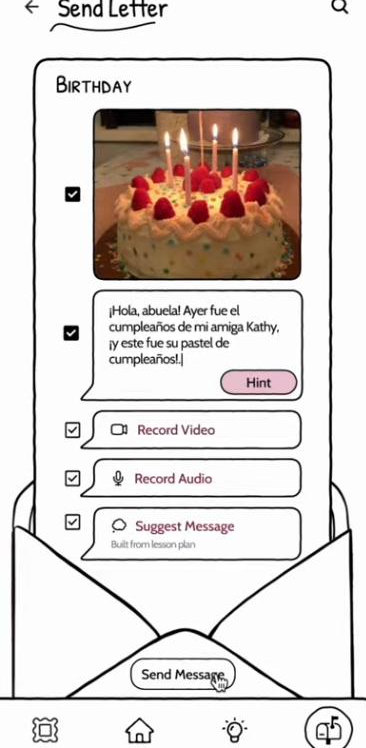
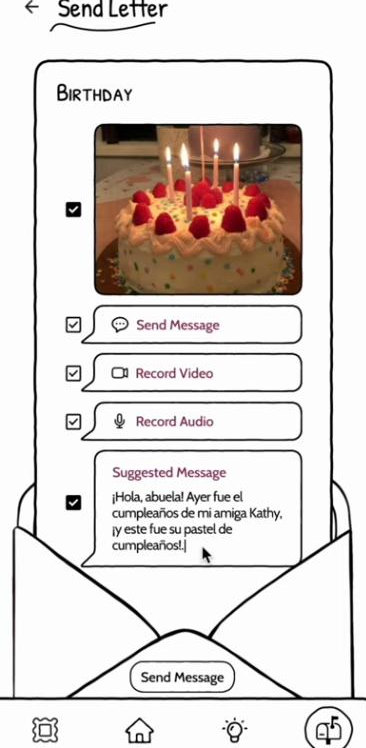
Send Letter screen: a Spanish message about the birthday cake written in an envelope, with options to record video, audio or use a suggested message.
Write the letter
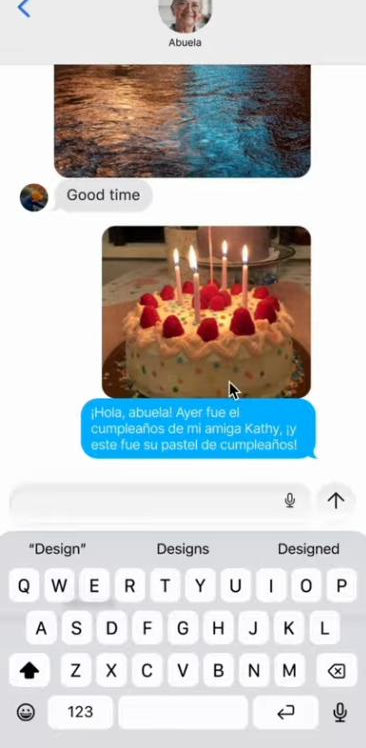
The letter arriving in a regular Messages conversation with Abuela, with the cake photo and the Spanish message.
It arrives in Messages

Connection without obligation

Some grandchildren called because they felt they had to.

Sending a message is optional and takes a few taps. You decide when to send and what to include: the photo, a typed message, a video, a voice recording, or a message memo. suggests from the lesson.

A short letter about your week is easier to send than finding time for a call, so grandchildren can reach out on their own terms and grandparents still hear from them.

Send Letter with a suggested message filled in from the lesson.
A suggested message
Home screen with lesson letters; the Birthday cake letter has just been stamped and postmarked.
Sent letters get a postmark

Culturally adaptive

Cultural expectations affect what families are comfortable talking about.

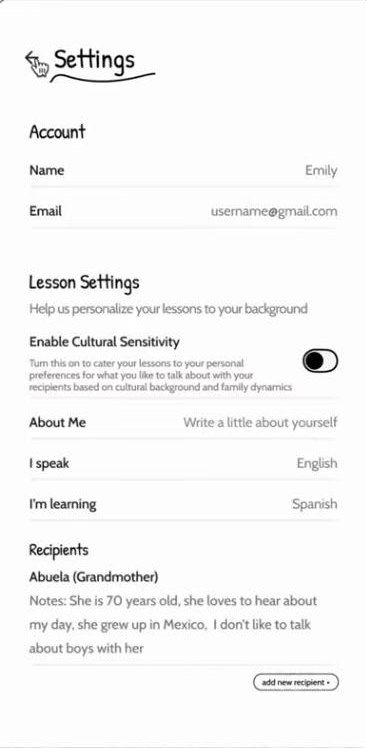
In settings you choose the language you speak and the one you’re learning, turn on cultural sensitivity, and add notes about each recipient, such as “She grew up in Mexico. I don’t like to talk about boys with her.” Lessons take these notes into account.

Settings: name, a Cultural Sensitivity toggle, About Me, I speak English, I’m learning Spanish, and a recipient note about Abuela.
Languages, sensitivity and recipients

A photo archive

Families kept shared albums to stay part of each other’s lives.

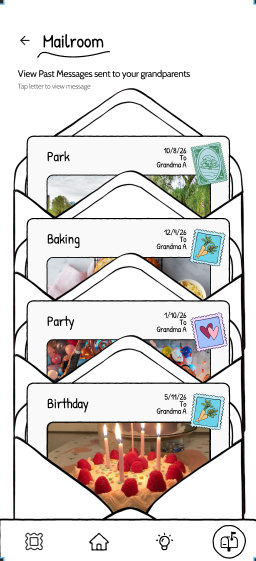
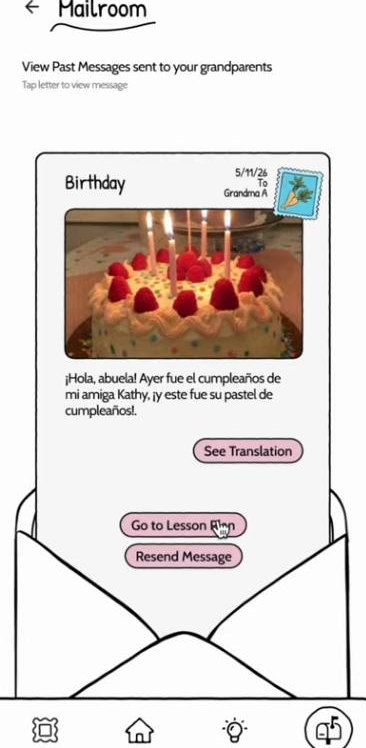
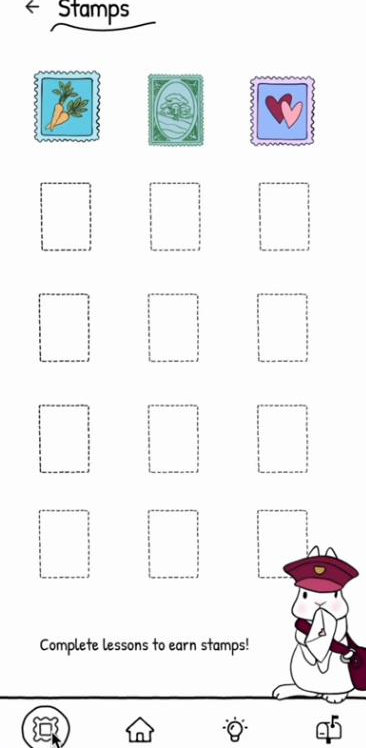
The Mailroom keeps every letter you’ve sent, with its photo, date and recipient. You can open one to see a translation, resend it, or go back to its lesson. Every finished lesson plan also adds a stamp to your collection.

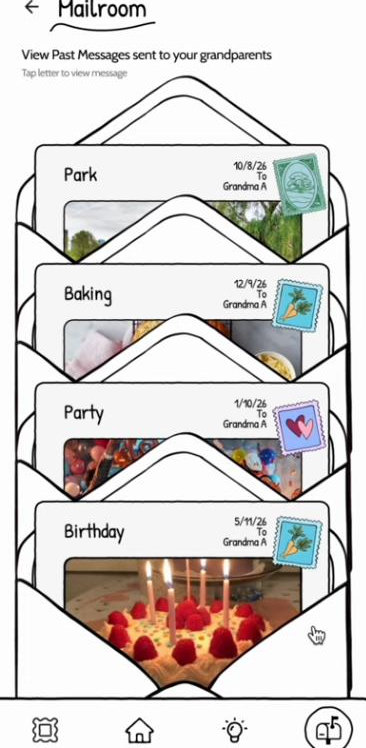
Mailroom: a stack of sent letters titled Park, Baking, Party and Birthday, each with a date and stamp.
The Mailroom
An opened letter in the Mailroom with See Translation, Go to Lesson Plan and Resend Message buttons.
An opened letter
Stamp collection with three earned stamps and empty dashed slots, and the rabbit saying Complete lessons to earn stamps.
Stamp collection

Try it

Our prototype, rebuilt so you can use it.

I rebuilt our Figma screens in HTML so they work like the app: you can type in the fields, pick words, toggle settings, chat with Grandma and choose what goes in your letter. The camera, Messages, Mailroom list and stamp collection are our original screens.

Two steps were missing from our prototype, so I drew them in the same style: the stamp you get after finishing the whole lesson plan, and an ink postmark after you send a letter.

Make a lesson and write to Grandma

Start on the home screen. If a tap does nothing, the active areas light up.

  1. Build a lesson from a photo
  2. Practise with Grandma
  3. Get the lesson plan stamp
  4. Send her a letter

Home

Welcome Back to Memo!

Build your language skills and send a message to your loved ones with what you learned!

Pick up where you left off

Lessons

100%
100%
100%
100%
Carrot stampPostmark
Birthday cake
“I made a birthday cake for my friend’s party!”

Rebuilt from our Figma prototype

Reflections

Testing on paper earlyThe paper test showed us the first screens were confusing before we built anything in Figma.

Designing around a constraintGrandparents’ reluctance to adopt new technology changed our direction and led us to design only for grandchildren.

Who we didn’t reachMost participants were young and from the US and India, and the prototype only teaches Spanish. We didn’t design for grandparents’ hearing or device limits.

What I would do next

Test memo. with grandchildren and their grandparents.

We planned three studies: moderated usability testing (create a lesson plan, learn phrases, share progress), interviews about language confidence and closeness before and after use, and observation at home ending with a real message to a grandparent on WhatsApp.

After that, I would design the grandparent’s side of the exchange and add more languages and dialects.